Binance Coin (BNB) Follows Bitcoin to Breach September High!

After days of trailing behind Cardano in terms of market capitalization, a recent up move has helped Binance Coin get back its third position. This time BNB has created a difference of close to 15% between its and ADA’s market capitalization. One might wonder why BNB. Well, Binance is a considerable cryptocurrency exchange, but it’s a centralized one.
Since cryptocurrencies themselves highlight a decentralized nature free of anyone’s control, Binance thought of creating a decentralized network and named BNB as the utility token for its decentralized cryptocurrency exchanges.
BNB now holds a combined market capitalization of above $80.5 billion with 168 million coins in circulation. It was initially developed as an ERC20 token and uses proof of stake consensus to validate transactions, allowing BNB to work with smart contracts and consume much less electricity than proof of work-based cryptocurrencies.
Binance Coin Price Analysis
BNB is in a trending price movement with the close possibility of trading above the $500 mark.
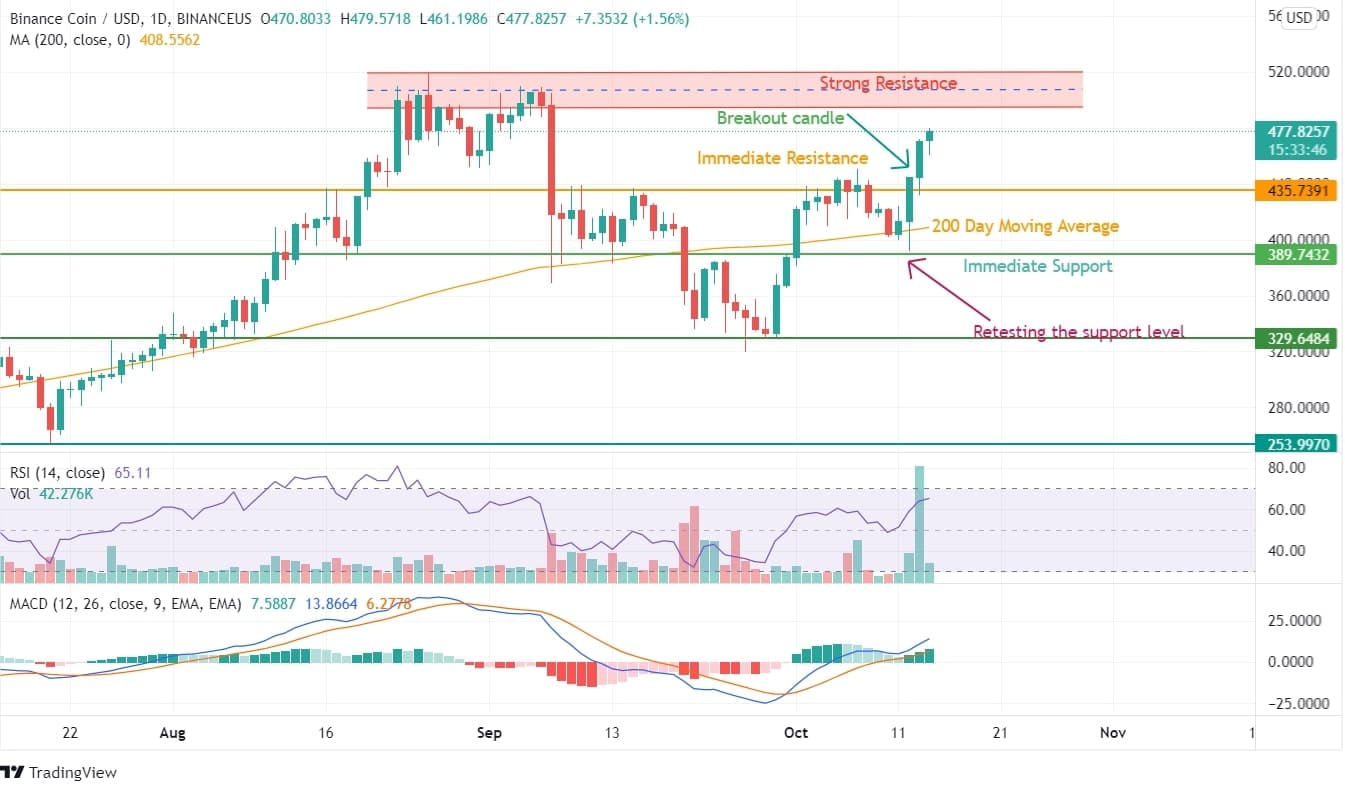
 Binance Coin has been an underdog in terms of its user services, but the move towards decentralized cryptocurrency exchanges has brought BNB coin to the limelight. BNB was in a clear downtrend till it took support at $329. After that, the ensuing reversal of sentiment and back-to-back buying has brought BNB to the fresh highs of $475, which is close to 40%.
Before continuing with the rally, the BNB price has retested the immediate support level to ascertain if the buying sentiment is as strong as it reads in charts and indicators. The price action failed to breach the 200 DMA curve on a closing basis, and getting strong support from its 200 DMA of $409 has created a new buying sentiment on BNB cryptocurrency.
Since assuring support of 200 DMA, BNB has moved up by close to 22% in just three days. The sentiment can be analyzed because RSI has moved from 50 to 66 in just six days. Imagine the buyers at this level expecting heavy returns. Other than the 200 days moving average curve, $390 has also emerged as a strong support level. MACD has been slowly moving upwards, reiterating a positive stance at this cryptocurrency.
 Binance Coin on hourly charts gives a better picture behind the price momentum occurring close to the retesting of the 200 DMA curve. After consolidating for a few days within $395 and $420, BNB attempted a breakout from lower levels of its charts, touching $430. However, within hours of this breakout, the BNB price kept on breaching immediate levels at $450 and $460 before succumbing to the profit booking. However, this profit booking brought the attention of buyers into this cryptocurrency in place of sellers. Hence now we are close to a new limit of $500.
RSI has hit the upper limit or indicated overbuying, which can be dubbed as sellers halting their operations and waiting for some weakness. However, the trend line created by BNB moving higher has remained unbreached in closing value.


