

- Binance Coin (BNB), at the time of writing, was trading at $21.86, after hitting a 90-day high of $22.66 in the past 24 hours
- BNB coin has been on a continual upswing, and we foresee the current price of the coin to form a similar one with the same momentum
- The current price is supported by the immediate daily moving averages, and the 50-day and 200-day MA lie outside the 20-day Bollinger Band width
- Immediate intraday move experiences a pullback, and there happens a bearish MACD crossover
Binance Coin trades impressively well as it hits above the major resistance at $20 and marks a fresh 90-day high.
Binance Coin Price Analysis:
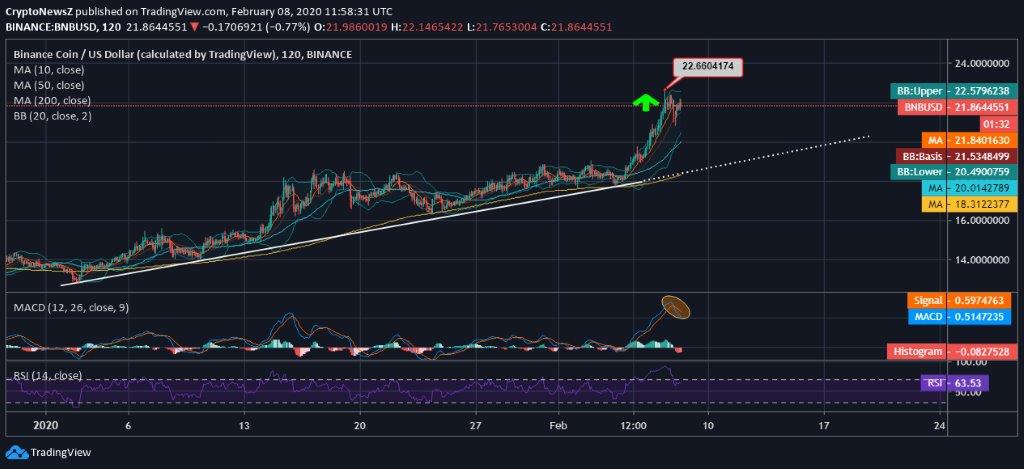
Taking a glance at BNB/USD 2-hourly movement over the past 5 weeks, we see that the coin takes a steep rise after having moved relaxingly in the previous month. Based on Our BNB Coin Price Prediction, the uptrend forming is foreseen to continue in the upcoming days as well due to steady support from the daily moving averages.
A fresh 90-day high marked at $22.6 appears to be the major resistance before the Binance Coin takes a leap above it on the daily chart. The 20-day Bollinger Bands laid do not project about any unpredictable volatility. The 50-day and 200-day support lines end out of the 20-day Bollinger Band width and hold a “Golden Crossover” as the 50-day MA is crossing above 200-day MA.
Technicals:
The MACD of Binance Coin is facing a bearish crossover as it is overridden by the signal line due to intraday price correction after the coin had hit 90-day high.
The RSI of BNB coin is also seen returning from the overbought region at 63.53, as the price pulls back, and the coin trades at $21.86.