Bitcoin – An Inch Away from Drawing a Complete Bearish Trendline

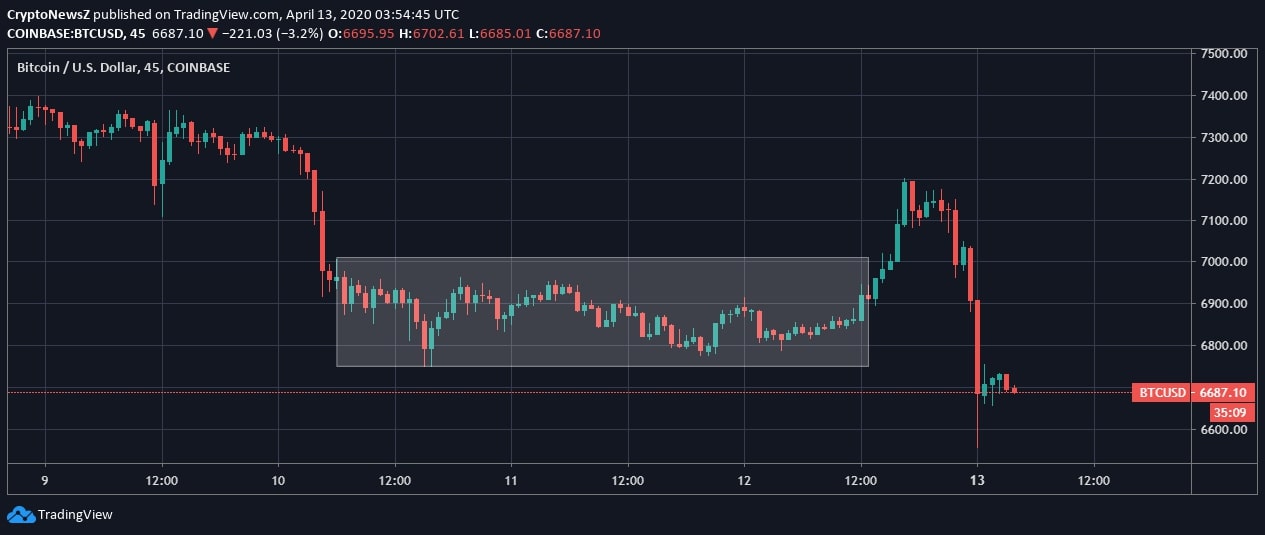
- Bitcoin opens below $6.6k, and 38.20% Fib Retracement Level on Monday, April 13, 2020, as the bearish candlesticks breach the lower 20-day Bollinger Bands
- BTC/USD price has dropped from the 30-day high and resistance of $7,400 and retested the weekly support below $6,600 on the hourly chart
- The coin has formed new and strong support at $6,500, and a weekly close below this point will draw a bearish trend line
You receive either 5 BTC or $75,000 in cash.
You cannot sell or exchange either for 10 years.
Which one are you holding?#bitcoin
— Binance Academy (@BinanceAcademy) April 12, 2020
Taking the question of the above tweet further, as per the current economic condition is concerned, inflation is going to be the major hindrance for the economy to make a comeback. Now, why to consider Bitcoin or cryptos as an investment at this point in time? The answer to this is complex yet simple to understand that the stock market and the other traditional assets have been recording the lows of all times with intermittent recoveries. Alongside, as the government tries to combat the losses and inject money in the economy as the Pandemic takes the toll, we get closer to the risk of hyperinflation again, leading to the same old story of “Rich getting Richer and Poor becoming Poorer.” So, the answer to the present investment avenue remains simple and go-getter.
Bitcoin Price Analysis
 The intraday chart of Bitcoin against the US Dollar appears bearish as the coin opens with a trend reversal and drops below the weekly support of $6,600. The price accumulation over the weekend drew the lowest below $6,800, and even further fall is likely to take the BTC price below $6,500, and the bearishness will roll. However, a turn above $6,700 will let the bulls get back in the picture.
 Similarly, the hourly chart of Bitcoin against the US Dollar shows an extended and steep fall as the candlestick plummets below 38.20% Fib retracement level. The 20-day day Bollinger Bands laid are seen widening, hinting towards the upcoming volatility which is likely to break or make the market. The BTC current price has lost imminent support from the 50-day and 200-day daily moving average as it breaches below the lower Bollinger Band. Check out Bitcoin price prediction today to know the possible price levels for the future.
The technical also emphasize the bearish crossover as the signal line of BTC crosses above the MACD line, and the RSI drops to 31.77, emphasizing the selling pressure of the coin.


