Bitcoin and Litecoin Slide, With Latter Facing High Volatility

- Bitcoin trades with a directionless and stout motion above $9,000 price area
- Litecoin seems to have a more volatile motion in comparison to Bitcoin
- BTC price drops around the major support area from a still trading ground that was formed near $9,350
- LTC price also fell to trade around $62.83, in the early hours of the day today
Bitcoin (BTC) slides down from testing the major resistance at $9,500 to testing the major support area around $9,200. The 20-day, 30-day, and 50-day SMAs and EMAs currently provide support below $9,000, if at all the coin takes a downward stride after testing the support at $9,000. Moreover, the trend has been quite monotonous as BTC price has been lingering in the price range of $9,000 and $9,300 since forever now, with a few crossovers above $9,350.
Litecoin (LTC), on the other hand, slid from the high of $64.27 to the lowest of yesterday at $62.96. Also, it shows a more defined volatility in comparison to Bitcoin. Currently, LTC coin trades in the midrange of the lowest and the highest price marked over the month. Current trading price of Litecoin is supported by 5-day SMA.
Litecoin vs Bitcoin Price Analysis:

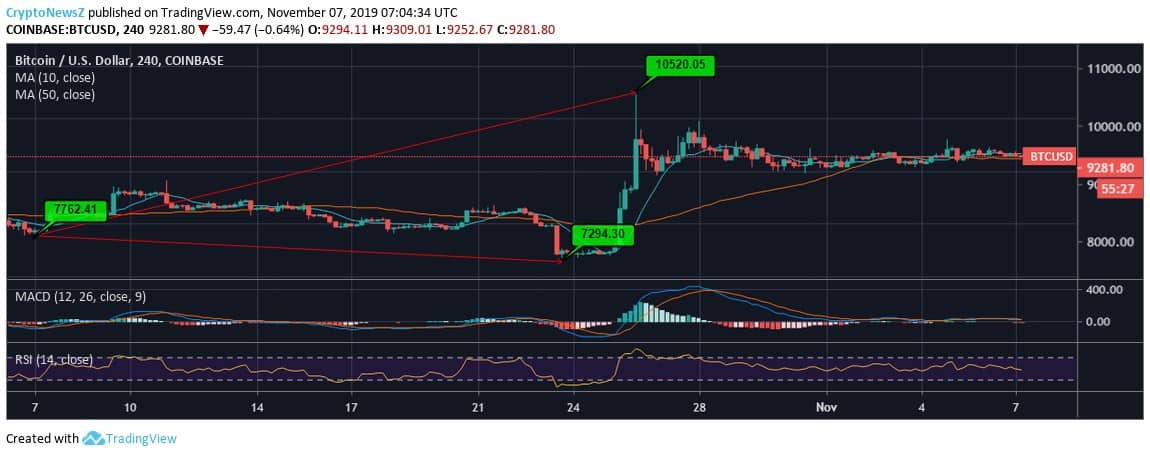
Analyzing the 4-hour movement of BTC, we see that the price trend has been divided into three parts. Previous to the 30-day rise at $10,520.05, the Price of Bitcoin hit rock bottom at $7,294.30, testing all the supports from $8,000 to $7,200. However, it has not been below $7,000 which was a slight sigh of relief for the investors. Unable to hold the tip, BTC plunged and is now testing support around $9,200 at $9,281.

While comparing, the Litecoin price trend shows a more volatile move when compared to BTC. However, it has also slid to trading around $62, after having started the 30-day duration at $53.19. The coin has rightly tested the support at $62, and if it even falls further it may cross $60, unable to exercise beyond $65.
Technical Indicators of Bitcoin:
Bitcoin’s 10-day moving average is a supporting hand around the current trade price at $9281.80, while the 50-day MA lies at $8,655.69
The MACD of the BTC coin is having an adjacent move to zero with a bearish outlook as the signal line overpowers the MACD line, and the RSI is at 50, showing no extremities.
Technical Indicators of Litecoin:
Litecoin’s 10-day moving average is approaching like the immediate support at $60.29, while the 50-day MA lies at $58.23
The MACD of the coin is above zero with the MACD line and signal line having a meetup, and the RSI is inclined towards the overbought zone at 70. Also, check on the Litecoin Prediction to get an idea about the coin’s momentum for the upcoming period.


