Bitcoin and Ripple Gear up for the Next Bull-run with a Bit of Volatility

-
- Bitcoin maintains a steady yet subtle uptrend amid volatility
- Ripple manifests price recovery to $0.30 over the last couple of days; traces a bullish trendline
- Bitcoin kept the support level of $9000 intact, currently testing resistance above $9400
- Both the major crypto coins hint towards the upcoming bullish market
The month of November has started on a positive note for the crypto market. The foremost crypto coin BTC has been on a steady bullish spree for the last one week. Bitcoin price has recently climbed above $9400, where it is likely to meet hurdles. Around a week ago, the coin was quite bearish as it had slipped below $9100 from its price level at $9370.60. Click here to know more about what will happen in the future.
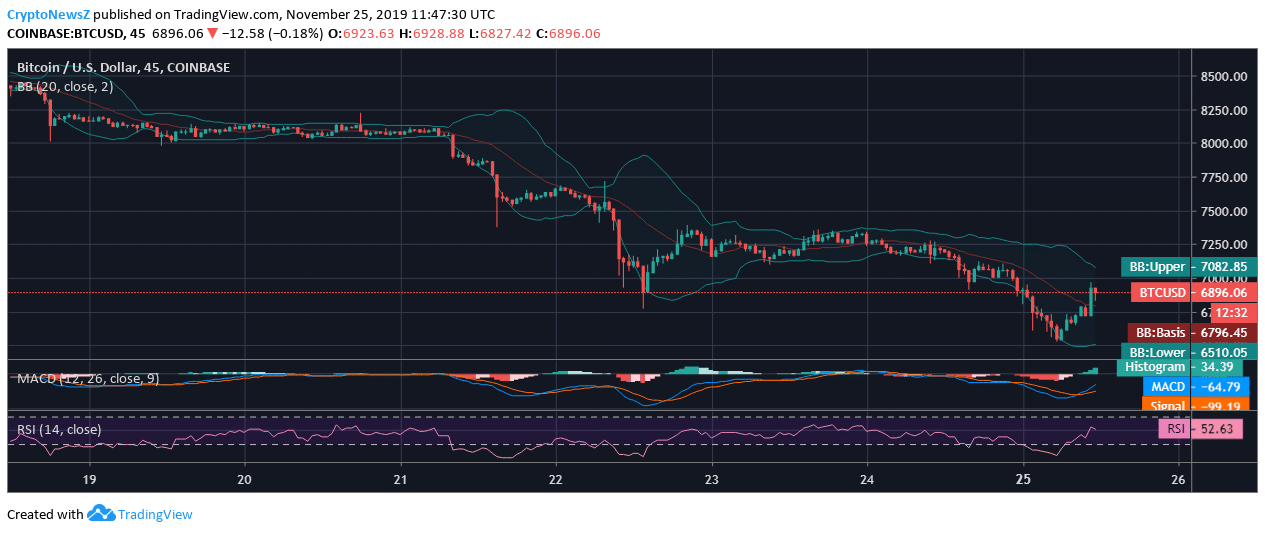
BTC to USD Price Chart
Bitcoin sharply rebounded to $9329.83 with an increase of 3.07%. Since then, the coin has maintained an uptrend except for a few pullbacks near $9100. The recent price rally, which took place two days ago, has ushered the BTC price above $9470 with an increase of 3.68%. After a sharp pullback, Bitcoin has again reclaimed its price range above $9390. At 08:39:31 UTC, BTC is trading at $9400.
XRP to USD Price Chart
On the other hand, Ripple has traced a low swing over this week. The coin, initially lost its price position from above $0.3033 to $0.2896, the lowest price mark of the week. After consolidating for a few days there, the XRP coin has struck a rebound on November 04, which took the Ripple price as high as $0.3034. Since then, the coin has been struggling to break out above $0.31.
Technical Indicators:
Ripple’s technical indicators are pointing towards the current bullish nature of the market, though, the coin is yet to step out of the bearish impact. The short term SMA line of XRP is above the long term SMA line noting an uptrend. MACD chart is heading for a bullish crossover, while RSI appears in the stable zone. Ripple is likely to meet resistance at $0.3045, $0.3078 and $0.3111 and support levels at $0.2979, $0.2946 and $0.2913.
Similarly, Bitcoin’s SMA lines and MACD lines have formed bullish crossovers, with its RSI indicator near 60, showing no extremities. As per our expert’s Bitcoin forecast, BTC may face resistance at $9,447.66, $9,552.78 and $9,648.15 and support levels at $9,247.17, $9,151.8 and $9,046.68.


