Bitcoin (BTC) Indicates Price Drop; Ethereum (ETH) & Ripple (XRP) Walks On The Same Path

Bitcoin (BTC/USD) Price Analysis:
 The largest coin of the crypto market is not indicating any positive sign. The currency shows a moderate price trend in the last week. The Market Cap of Bitcoin is dealing around $203,170,646,589 at 11:18 UTC. For understanding the momentum of the coin, let’s analyze the BTC price chart.
Above chart is indicating a price fall. The week started with 6th August. Bitcoin price was trading at $11827. The coin booked a downtrend of 2.94%. BTC dropped to $11480. On 7th August, the coin jumped from $11480 to $12001. The escalation was of 4.56%. Further, on 8th August, the price counter changed from $12001 to $12085 by 0.70%. On 9th August, the Bitcoin slipped from $12085 to $11909 by 1.50%. On 10th August, the coin took another drop of 4.76%. The price changed from $11909 to $11342. On 11th August, the coin escalated from $11342 to $11572 by 1.96%. Currently, the Bitcoin price is at $11401.
BTC might be seen rising towards the end of the week. Get more information about Bitcoin predictions and keep an eye on the future price ups and downs of the currency.
Ethereum (ETH/USD) Price Analysis:
 The second-largest coin of the crypto market is currently dealing at $212.53. The Market Cap of Ethereum stands at $22,768,359,000 (11.23 UTC). The upsurge in the ETH coin is expected to continue for quite some time.
The week-long Ethereum price chart is reflecting a downfall, but from the past few days, the coin started recovering. On 6th August, the coin opened at $233.81 and slipped to $226.32 by 3.17%. The coin kept a moderate movement on 7th August. ETH price changed from $226.32 to $225.64. On 8th August, the coin slipped from $225.64 to $221.98 by 1.58%. On 9th August, Ethereum price slipped from $221 to $214. The regression was of 3.33%. On 10th August, the coin changed places from $214.58 to $206.58. The fall was of 3.61%. Yesterday, the coin picked up from $206.58 to $217.05. The progression was of 5.15%. Ethereum is recommended for long-term traders. ETH coin would be touching new highs in the near future.
Ripple (XRP/USD) Price Analysis:
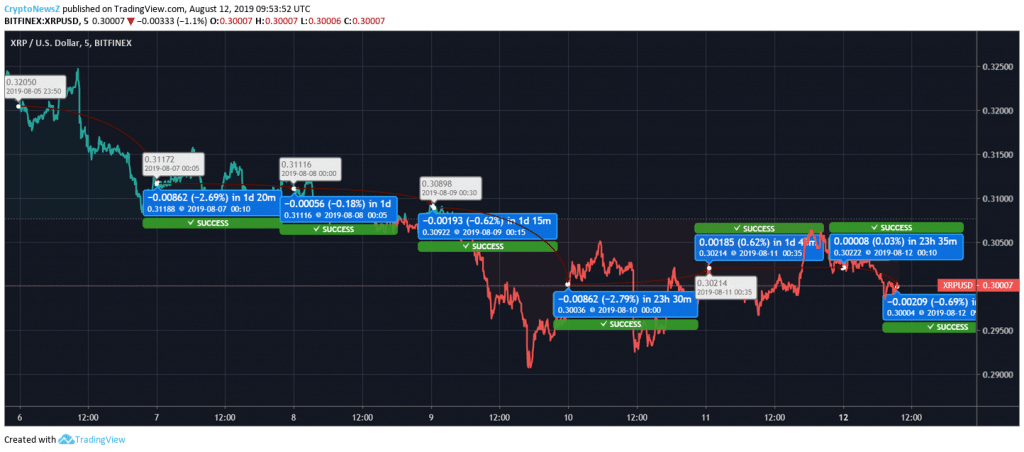
 The third-largest coin of the crypto market, Ripple (XRP) is trading at $0.30. The coin is dealing with bearish nature. The Market Cap of XRP is at $12,858,954,724 (11:27 UTC). Let’s have a look at the XRP price chart for the last week.
Ripple price was at $0.320 on 6th August. The coin slipped from $0.320 to $0.311 by 2.69%. On 7th August, XRP kept a moderate movement. The price changed from $0.3118 to $0.31116 by 0.18%. On 8th August, the coin slipped from $0.31116 to $0.30922. The regression was of 0.62%. There was a major downtrend in the price of Ripple on 9th August. XRP price switched from $0.30922 to $0.30036. The regression marked was of 2.79%. On 10th August, the coin escalated from $0.300 to $0.302. The hike was of 0.62%. The coin again maintained a low profile on 11th August. Ripple price moved from $0.3021 to $0.3022 by 0.03%. Today, XRP coin opened with a downtrend. The coin slipped from $0.302 to $0.300. The regression marked was of 0.69%. Investing in the third-largest wouldn’t go futile. As per analysis and historical data, the long-term investment plan is most suited for Ripple.


