Bitcoin (BTC) Price Analysis : Analysis of Bitcoin’s Recuperating Market

Bitcoin is the first largest introduced into the crypto market. It is an open source digital payment currency that uses a digital medium of exchange. It’s peer-to-peer technology create and control monetary transactions on the exchange platform. Compared to the cryptocurrencies introduced after BTC, Transactions on BTC platform are rather simple, and the payments are made via Bitcoin wallet App on the user’s system or mobile device, with no requirement for intermediaries. Bitcoin is mined using specialized hardware which processes the transaction and secures the network. It still is the most craved on cryptocurrency, even today.
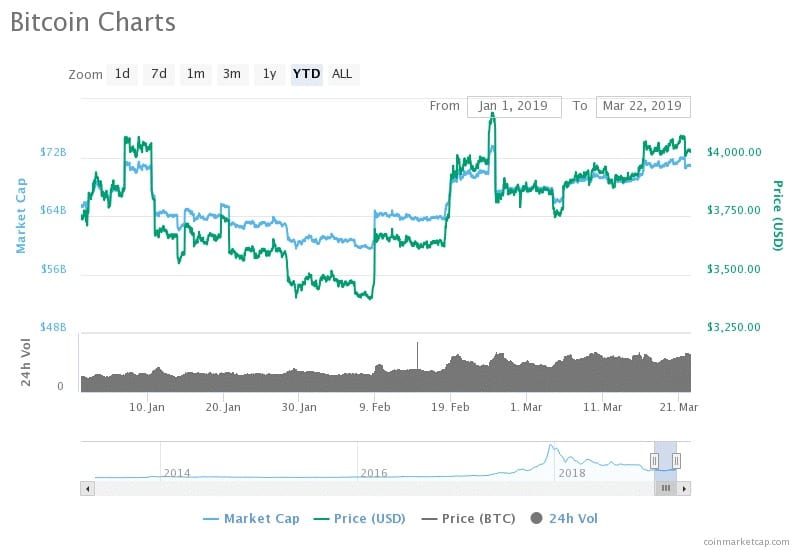
 Bitcoin is the 1st largest cryptocurrency introduced into the market. According to CoinMarketCap, the current MCap value of BTC is trading at $70,997,225,021 USD for its corresponding 24h volume of $10,615,713,260. The price of USD for the present value is $4,033.19 on March 22 at 13:54 UTC. This is calculated based on the circulating supply of 17,603,225 BTC Coins out of a total of 21,000,000 coins. The current MCap value is higher than its relative value of USD 65,945,195,957 on February 18 by 7.66%. The market cap of Bitcoin opened at 65 million USD at the beginning of the year and spiked on January 06 with a value of USD 71,318,715,546 for the price of USD of $4,083.15. However, the market capsized with the values descending between January 11 and February 17. The lowest MCap value of Bitcoin was $59,621,589,267 USD for the corresponding 24h volume of $5,028,593,921 on February 08. The current value is higher the all-time low by 19.08% and the price per Bitcoin was $3402.02. The value of Bitcoin improvised after the downfall period lasting briefly between February 18 and February 24. It reached an all-time high on February 24 at 12:34 UTC along with the price of USD.
The Mcap Value traded at USD 73,566,402,312, higher by 3.62% from the present day value. The peak price of USD was $4190.57, and the percentage difference with the current value was similar to the MCap values. Bitcoin is a volatile cryptocurrency, due to which, the MCap and the price fell from its all-time high to $67,356,158,951 with a different percentage of 9.22%. The analysis shows that the recent values have been on a raise concerning both Mcap values and price of USD. This is proved by the significant percentage difference in current value with the 20-day Exponential Moving Average. The values rose from $67,642,509,052 on March 02 to the current value by 4.96%. The 14-day MA analysis also shows an increase in percentage value from USD 69,055,972,598 on March 08. This percentage increase in both the moving averages and the overall booming market exerts the bullish pressure on the cryptocurrency. The market trend on a stable increase and based on our BTC price Prediction, the advantage of the bullish pressure forces the market balances rest in favor of the buyers.
The crypto coin reached its milestone with the price of USD per Bitcoin shooting between February 18 and 24, with the values increasing from $3628.61 to $4,190.57 by 15.49%, a spectacular rise within 06 days. This means its investment period for both- the traders and the investors on BTC. Their continued contribution to this cryptocurrency will further stabilize the value in the future.


