Bitcoin Bulls Pushing Harder to Cross Above $10,400; Trades with a Mixed Sentiment

- Bitcoin has just tested support levels below $10,100, all set to rebound
- The price level of $10,090.79 acted as decent support recently
- Another price rally above $10,600 can be anticipated if the uptrend remains intact
- The 4-hourly chart gives positive signs; SMA lines proceed for a bullish crossover
Recent Bitcoin price surge, which took it above $10,800, has helped the market to see some positive momentum for a couple of days. However, the BTC price has been pulled back below $10,500. The pullback proves that the BTC bull-run was momentary as major altcoins like Ripple, also seem to be struggling to stay above the key supports.
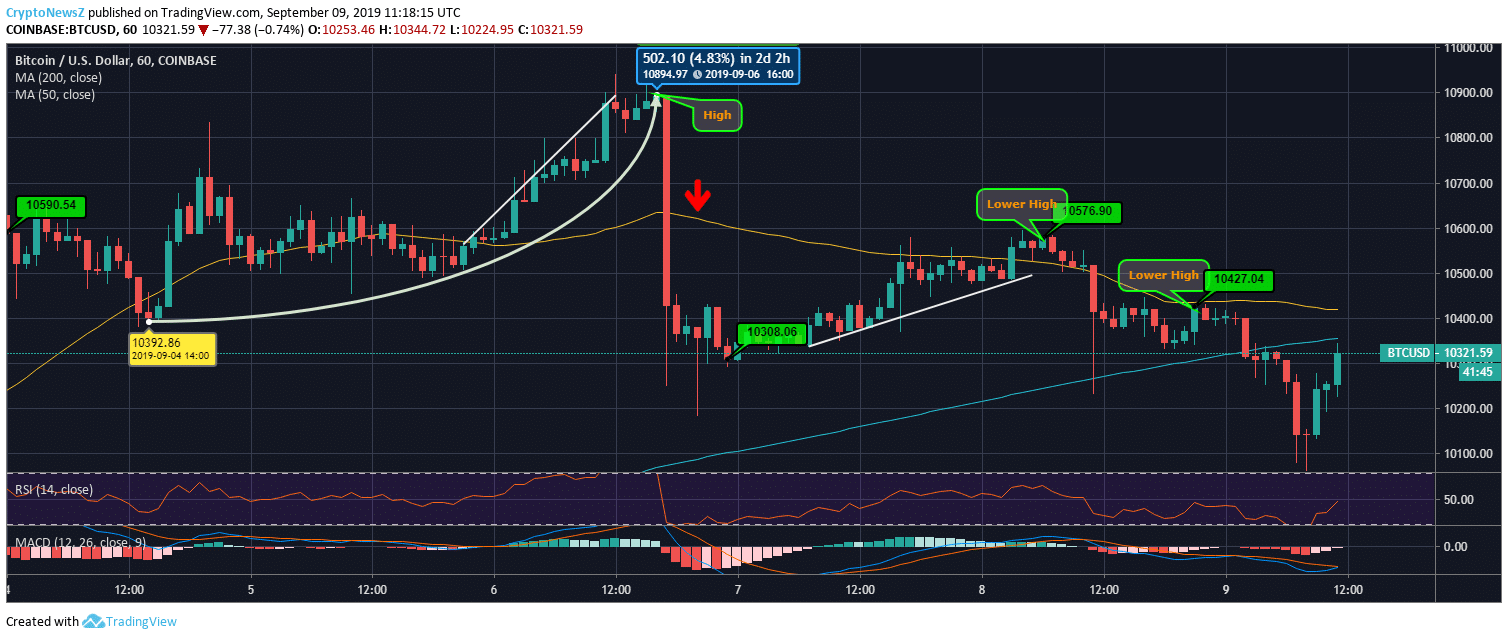
Nevertheless, Bitcoin bulls have recently hustled with a notable potential, as it is again approaching $10,500 after a dip below $10,100. The 5-day chart shows how the coin rallied above $10,800 and then sharply pulled back. The pullback was strong enough to cross below significant support levels around $10,500 and $10,400.
BTC to USD Price Chart

After a mild recovery, yesterday, BTC reclaimed the price range above $10,500 while tracing a bullish trendline. Since then, the coin has been constantly dropping, and it has even traced two lower highs showing a bearish trend. Resuming the rise, Bitcoin value has reached above $10,321.59 at 11:18:15 UTC today.
Bitcoin 4-Hourly Price Chart
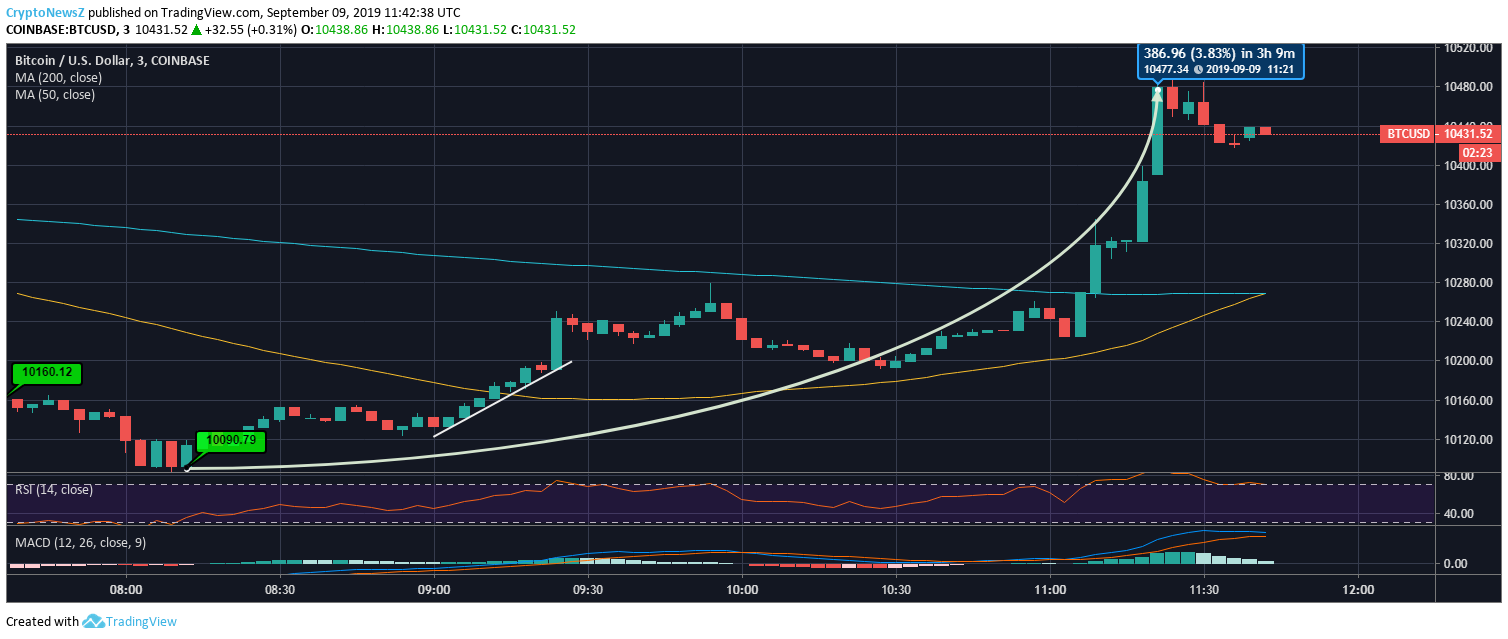
Bitcoin chart for the time span of the last 4 hours, shows an apparent increase of more than $271. After dipping below $10,100, BTC has found support at $10,090.79. From there, the coin has struck a rise of 3.83% reaching $10,477.34. Correcting down a bit, Bitcoin price today is trading at $10,431.52 at 11:42:38 UTC.
In the 4-hour chart, all three technical indicators like SMA, MACD, and RSI look bullish. The 50-day SMA line is about to cross above the 200-day SMA line. RSI is near 80, showing an overbought phase, while MACD indicator is in the bullish zone with its MACD line is above the signal line. Recently, as per Bitcoin prediction, its price may see resistance at $10,554.92, $10,668.55, and $10,741.47, while it can find support levels at $10,295.45 and $10,181.82.


