Bitcoin Cash (BCH), Litecoin (LTC), and Binance Coin (BNB) Register a Steep Fall

Bitcoin Cash Price Analysis:
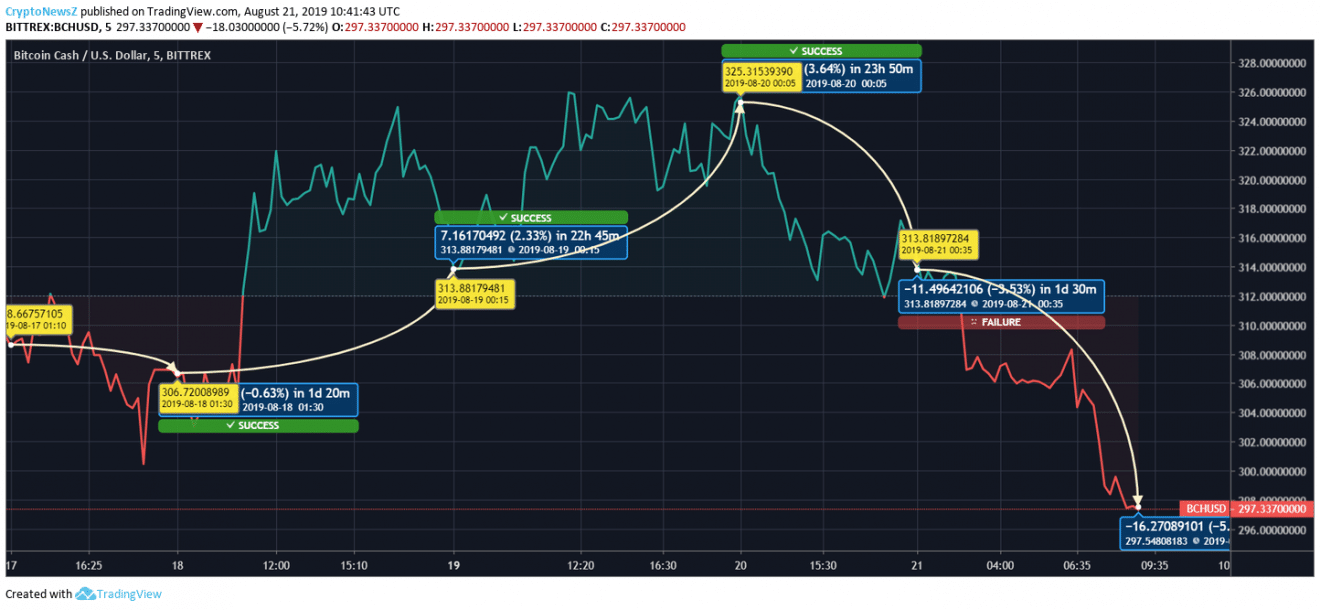
Bitcoin Cash is the fourth largest coin in the market. The coin is currently dealing at $297.337. The market cap is noted as $5,392,510,967. The five-day BCH price chart is reflecting a steep drop. Let’s have a detailed look.

Starting from 17th August, Bitcoin Cash started falling. The drop was of 0.63% from $308 to $306. On 18th August, the coin escalated from $306 to $313 by 2.33%. On 19th August, the coin took another leap of 3.64% from $313 to $325. Yesterday, the coin fell from $325 to $313. Today, the coin kept falling, and the price changed from $313 to $297. The regression marked was of 5%.
The coin has a high prospect of improvement in the coming years, and the coin would be best for long-term traders. They are likely to register a considerable profit in the future.
Litecoin Price Analysis:
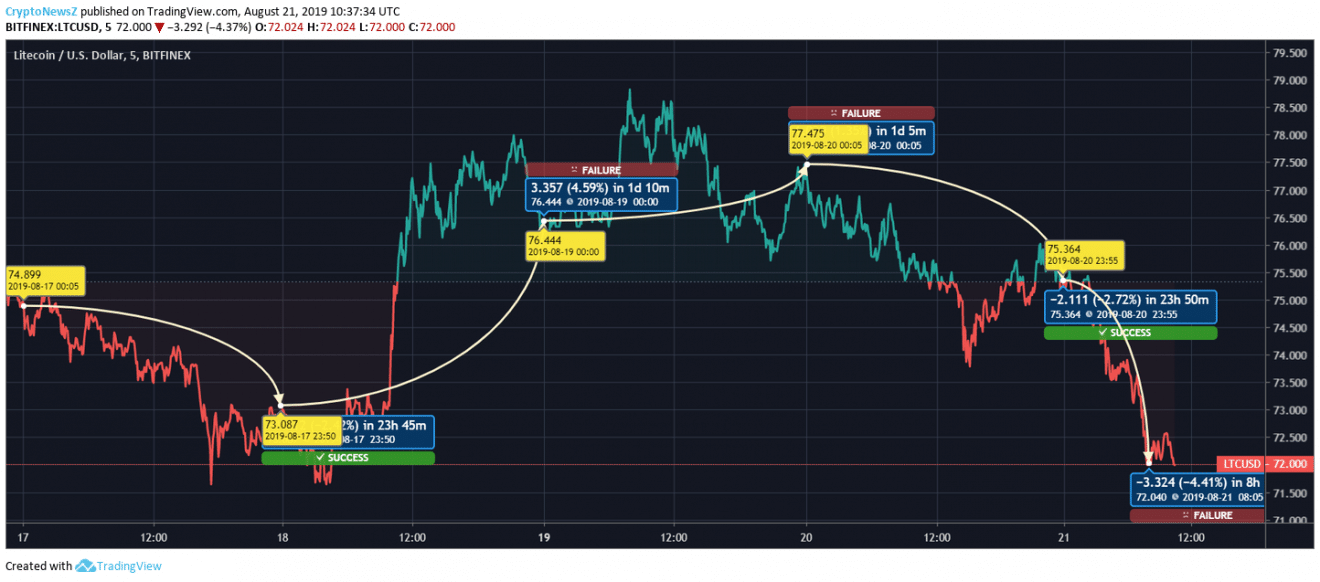
Litecoin is the fifth-largest coin in the market. The coin is currently dealing at $72. The market cap is noted as $4,540,005,752 at 11:22 UTC.

In the above 5-day chart, the coin was seen improving for some time, but later, it started falling. Let’s have a look. Litecoin chart is reflecting a heave drop in the price. The coin was dealing at $74.899 on 17th August. On the same day, the LTC price registered a drop of 3.52% as the coin closed at $73.087. On 18th August, the currency registered an upsurge of 4.59% from $73.087 to $76.444. On 19th August, the upsurge in the Litecoin was of 2.52% as the price switched from $76.444 to $77.475. The coin started dropping in yesterday’s chart. The price changed from $77.475 to $75.364 by 2.72%. Today, the fall is again massive. Litecoin has slipped from $75.364 to $72.040 by 4.41%. The coin is expected to recover soon.
The currency is anticipated to climb in the coming years. The coin would be best suited for long-term investment. The traders of the given period are likely to make a colossal profit.
Binance Coin Price Analysis:
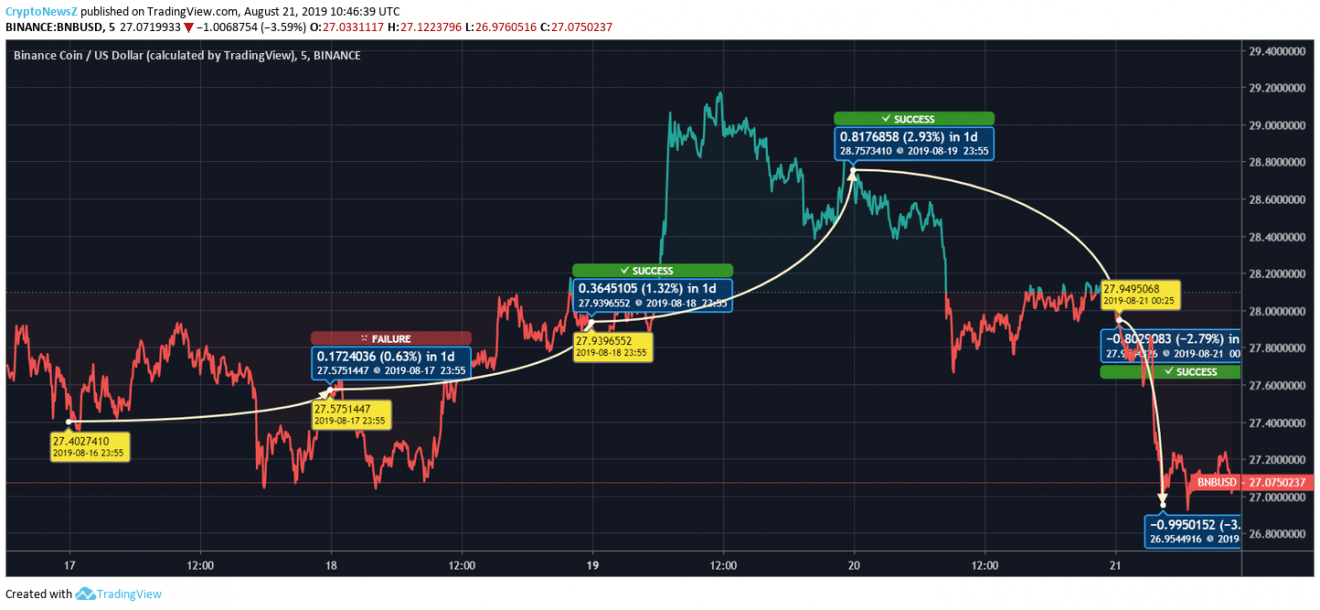
Binance Coin (BNB) is the sixth-largest coin in the market. The coin is currently dealing at $27.075. The market cap is noted as $4,223,580,167. The 5-day chart is indicating a recovery in the BNB coin price, which took a sudden drop.

On 17th August, the coin booked an escalation of 0.63%. The price changed from $27.4 to $27.5. On 18th Aug the escalation continued and moved up to $27.9 from $27.5 by 1.32%. On 19th August, the escalation in the coin took it up to $28.7 from $27.9 by 2.93%. On 20th August, the coin dropped from $28.7 to $27.9 by 2.79%. On 21st August, the coin slipped from $27.9 to $26.9 by 3%.
The coin is expected to move up in the coming years. The long-term traders are expected to earn massive returns in the future.


