Bitcoin Cash (BCH) Plunges Rapidly; Tests Support Below $195

- Bitcoin Cash trades below $200; records the lowest at $194 in the past 24 hours
- BCH price records a dip of over 27% from the highest ($214.75) to the lowest trading price ($194.76) in 24 hours
- BCH coin is on a continuous plunging spree since November 10, 2019
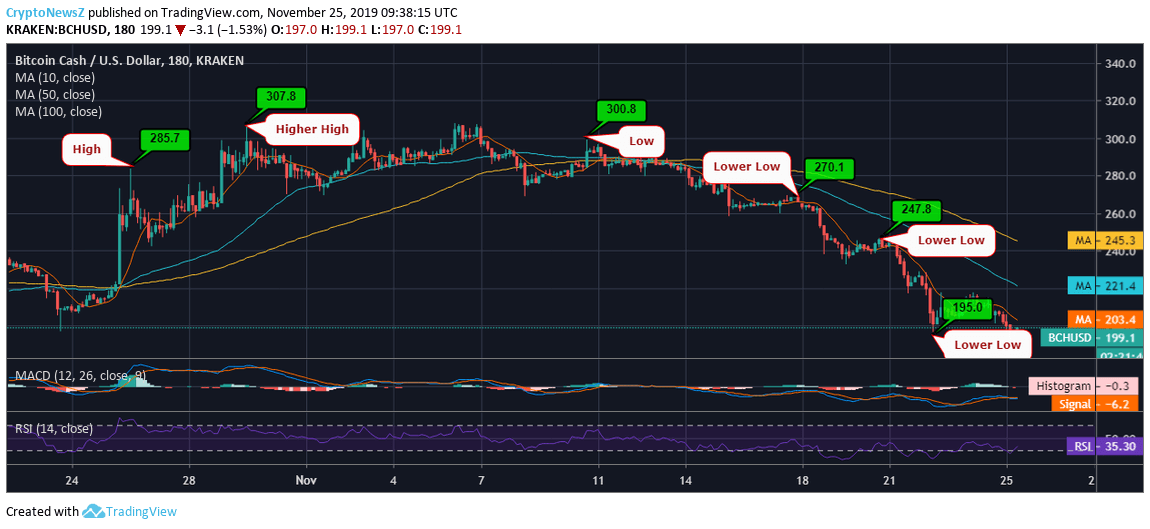
Bitcoin Cash rips off as the whole market, including the king of cryptocurrencies–Bitcoin is trading with inactive supports and falling rapidly. With this, BCH coin also lost its rank and is currently trading at 5th position (previous rank- 6th position). All the short-term and long-term moving averages are above $200–which was serving as the major support before the current fall.
Bitcoin Cash Price Analysis

Analyzing the 1-month price trend of BCH/USD on Kraken, we see that the coin was initially having an upward momentum when it faced major resistance around $308 and $310 towards the start of the ongoing month. Unable to resume the growth, Bitcoin Cash started sliding rapidly, facing inactive supports at $300, $270, $250, and $200. However, the decline rate in the past week has been quite fast comparatively, wherein the BCH price is currently moving without any support from the moving averages as well. Get more details about live price updates and BCH prediction by experts from our other section of the website.
The market scenario is exceptionally bearish and exhibits no sign of improvement any sooner. The 6-month low that BCH formed below $200 while it started its rapid dip is now becoming deeper and is marked at $194.76. BCH is definitely a good asset to buy & the coin is mainly recommended for long-term traders. BCH price growth seems to be slower.
Technical Indicators
The current trading price of Bitcoin Cash has no stranded support from the moving averages and 10-day, 50-day, 100-day lie at $203.4, $221.4, and $245.3, respectively.
The MACD of the BCH coin is running bearishly below zero as the current dip has all the inverse moving red candles that are emphasizing the fall even further.
The RSI is at 35.30, which shows and an inclination towards the oversold region and selling pressure under which the coin is trading.


