Bitcoin Cash (BCH) Retreats in the Intraday Yet Holds Bearish Crossover

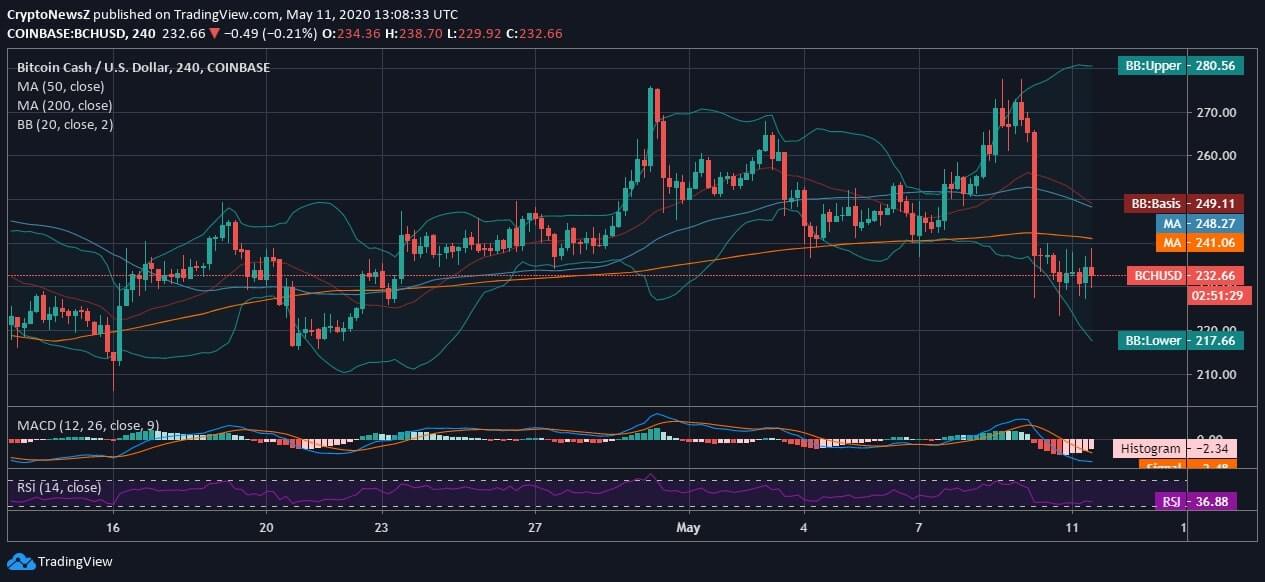
- Bitcoin Cash, at the time of penning down this analysis, was trading above $230 at $232.66 after retreating from 10-day support on the 4-hourly chart
- BCH price is yet to regain support even after reclaiming from the intraday low after a steep dip
- In yesterday’s trading session, the Bitcoin Cash price plummeted by approximately 14% from $266 to $227 drawing a bearish candle
- The 20-day Bollinger Bands laid to show that the coin is likely to face volatility in the upcoming days
- The technicals are drawing a bearish picture as the MACD holds a bearish divergence and the RSI is slightly above 30 or the selling zone
Bitcoin Cash Price Analysis

On the 4-hourly chart, Bitcoin Cash is reminiscent of Bitcoin’s price crash and being a hard fork; the former also lost 15% in just a few minutes, in yesterday’s trading session. Over the past four weeks, the BCH coin had been quite volatile and held resistance at $277 against the US Dollar. Confirming the same, the 20-day Bollinger Bands laid hold unprecedented volatility in the upcoming days. Moreover, as we stand on Bitcoin Halving day, BTC is nothing but the most volatile avenue today and is influencing the major altcoins and its hard folk as well.
The technical indicators of Bitcoin Cash laid to hold a bearish divergence as the signal line crosses above the MACD line after the steep fall, and the RSI of BCH coin holds at 36.88 around the selling zone due and breaches the lower 20-day Bollinger Band. For further details, just click here our BCH price forecast page to learn about Bitcoin Cash’s forthcoming price prediction.


