Bitcoin Cash Hustles to Remain Above $290 After a Few Dips below $286

- Bitcoin Cash (BCH) manifests a volatile intraday price chart amid positive signs
- BCH has recently reclaimed price range above $290; bulls appear round the corner
- The coin seems to have a support level near $285, and price barriers appear above $293
Bitcoin Cash has recently started to rebound after it tested the support near $286 against U.S.Dollar. The coin has traced an impulse pattern over the last one day, hitting highs above $293 and lows near $285.
Yesterday morning price actions of BCH coin were giving mixed signals till it saw a notable price rise at 11:45 UTC. The coin went as high as $294.18 before tracing a bearish trendline. After two lower highs, the coin dipped to $285.36, seeking support. Post a price rebound, BCH maintained its range above $287 till 7:00 UTC today, when it broke below $287 and then recovered its price with a sharp spike at $292.31.
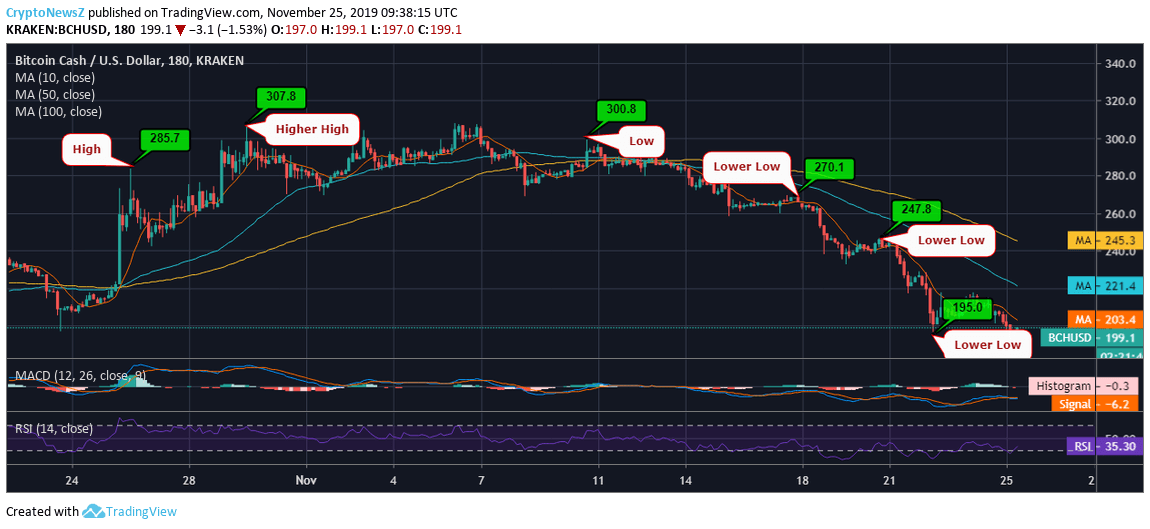
BCH to USD Price Chart

Three of the technical indicators give bullish signs as the Bitcoin Cash price is heading up. RSI is about to tap into the over-bought phase, while MACD is also heading towards a bullish zone with its MACD line above the signal line.
The Short term SMA line is pretty much above the long-term SMA line indicating a surge in Bitcoin Cash value. As Per BCH Prediction, the price of BCH will rise in the upcoming years. It is also expected by the end of 2025, and the BCH price will see tremendous growth. BCH is trading with a ‘Buy’ sentiment. The coin may face resistance at $294.94, $298.03, and $302.08 while its support levels can be at $287.8, $283.75, and $280.66.


