Bitcoin Draws a Bearish Intersection; Tests Support Around $8,400

- Bitcoin price sticks around $8,400 support after hitting the resistance at $8,637.91 in the past 24-hours
- BTC/USD price movement remains static since past 10 days
- Trades in the wider price range in between $8,000–$9,000; facing the greatest resistance at $9,000
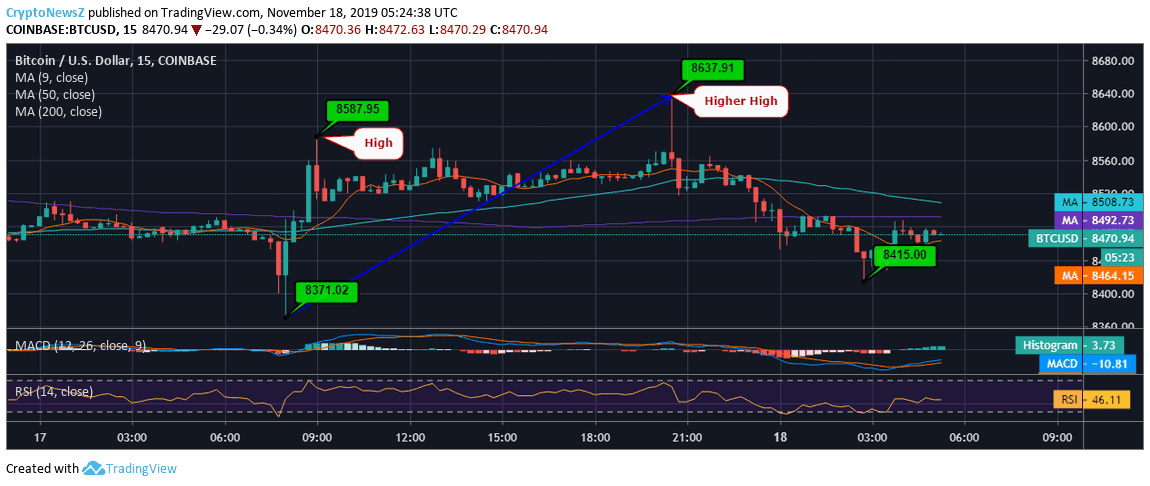
- In the past 24 hours, BTC price formed a narrow range trading from the lowest at $8371.02 to the highest at $8,637.91
Bitcoin has continued to draw a bearish trendline, after having slid from the trading price of $8,700 and $8,800. The short-term remains mildly volatile and bearish until BTC gains the momentum to have a bullish intersection above $9,000 and then beyond $9,200.
Bitcoin Price Analysis:
 Analyzing the intraday movement of the BTC coin, we see that the price continued to remain around the $8,400 mark. However, while approaching the midday trading hour, it fell as low as $8,371.02 with an inverse green candle formation. On the contrary, the red candle took the price to test the immediate resistance by 2.59% at $8,587.95, immediately. Later, the coin moved in the price area of $8,500 to test another resistance at $8,637.91 just to draw a bearish trend line today from trading at $8,415 to $8,470.94.
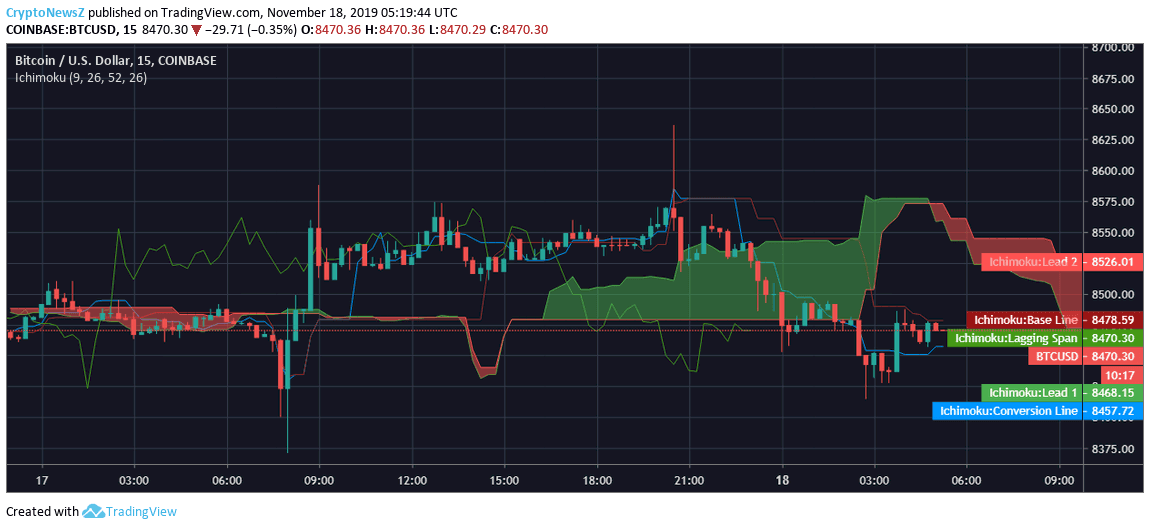
 As per the Ichimoku indicator, the current price trend is in between the baseline and conversion, with the baseline being above the price trend and conversion line being below the price trend. However, the leading span 2/B cuts the leading span 1/A, just at the time of writing, when the Bitcoin price slid to trade at $8,415.00, exhibiting the short-term bearishness that prevails. By clicking here, you can get more clarity on Bitcoin predictions.
Technical Indicators:
The current trading price is slightly above the daily 9-day MA, and on the contrary, when we consider the medium and long-term moving averages, the price is below both 50-day and 200-day moving averages.
The MACD of Bitcoin is below zero and holds a bearish crossover as the signal line cuts the MACD line.
The RSI of the BTC coin is at 46.11, showing an inclination towards the oversold region but no extremities at present. According to the Bitcoin forecast charts, BTC price might face downside correction and trade around $8450 in the upcoming hours.


