Bitcoin Exhibits a Bullish Signals; BTC/USD Trades Above $9.7k

- Bitcoin, at the time of writing this article, was trading with a bullish crossover above $9,000
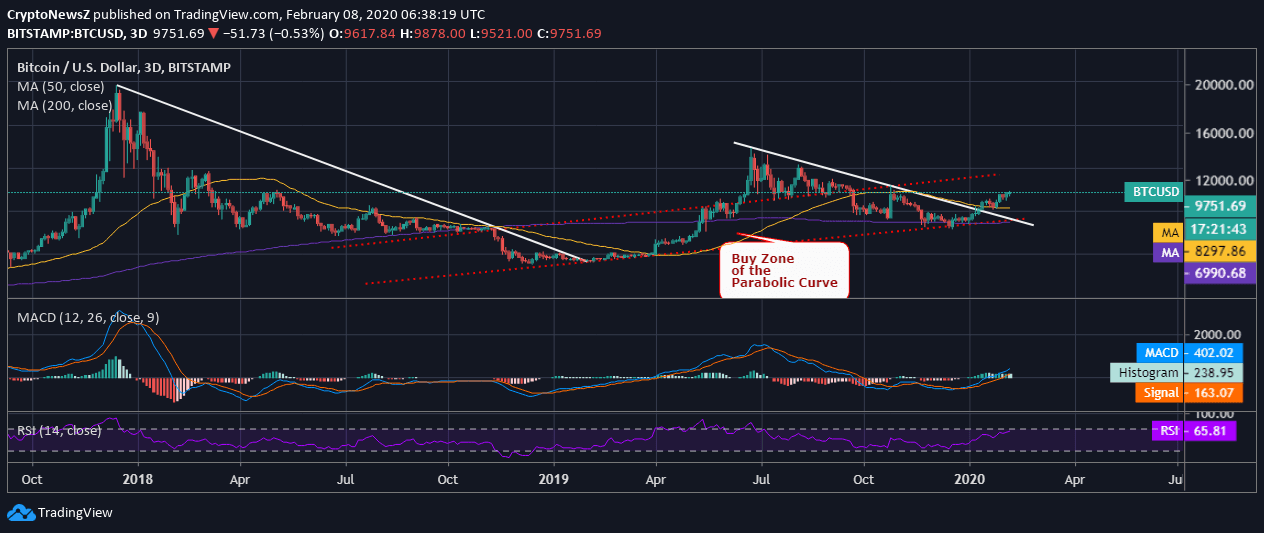
- The price trend of BTC seems to take a rising turn as per the current momentum and pattern which is confirmed from the parabolic pattern that it is reforming
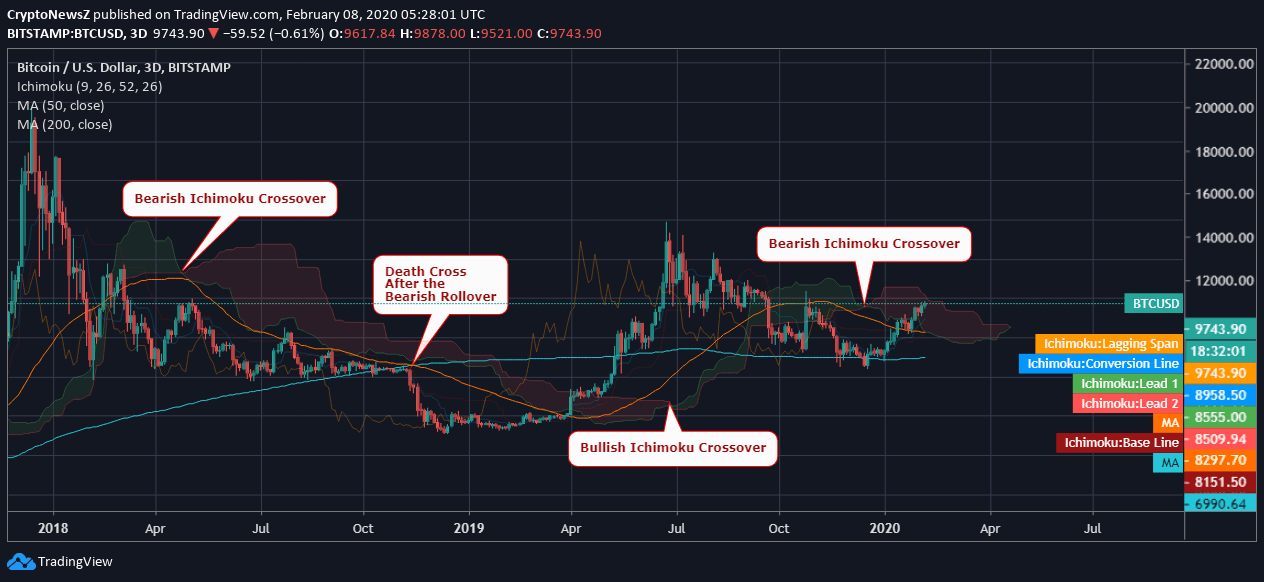
- Further, BTC/USD move is likely to have a Bullish Ichimoku Roll Over as Senkou Span A will hit above the Senkou Span B
- The current Bitcoin Value is under the strong “buy phase” as it again falls in the Parabolic growth curve zone
- A persistent move above $9,000 and $9,500 is likely to hit the major resistance at $9,800 and above
Laying the total emphasis on Ichimoku Signal that is turning bullish, is also rightly confirmed with the Parabolic Growth Curve.
Bitcoin Price Analysis
 Analyzing the above daily 3-day chart on Bitstamp, we see Ichimoku Cloud turning bullish as the Senkou Span A (green- Lead 1) is likely to hit above Senkou Span B (red- Lead 2). However, if we break down the total analysis of 2 years, we see that the price of Bitcoin had the first bearish Ichimoku Crossover in May 2018. This happened to be the first bearish crossover after the price soared to $20,000 in December 2017 and, therefore, gave a start to the bear cycle for the BTC which continued in the whole of 2018.
Having recovered from a strong decline that happened almost for a year, Ichimoku turned bullish in June 2019, which gave an instance for a price rally when Bitcoin had hit $13,000. And, repeating the cycle, we again faced a bearish rollover just before the onset of 2020 when BTC had hit rock bottom around $6,400 and lacked support & momentum.
However, important to note that there has been a death crossover, i.e., 200-day MA crossing above the 50-day MA after every bearish rollover and the vice versa happens after every bullish crossover.
Therefore, the current formation holds a strong probability of Ichimoku Bullish cloud breakout, which is likely to be followed by an uptrend and golden crossover (50-day MA above 200-day MA). Additionally, the long-term buy zone exhibits a Parabolic growth curve after having faced a pullback in December 2019.
You can browse our BTC predictions page to read more about price forecasts for coming years which help in your Bitcoin trading.
The MACD of Bitcoin is moving forward for a bullish crossover as the MACD line crosses above the signal line, and the RSI of BTC is at 65.81 which is likely to hit above 70 or the overbought region depending on the further momentum.


