Bitcoin Price Analysis: BTC Faces Turbulence; Bears Eyeing $9000?

- Bitcoin kept tumbling for the whole day, today’s price fall took it below $10,200 from above $10,600
- BTC traced a dip even below $10,100 recently, currently correcting above the mentioned price mark
- Bitcoin saw a pullback as it faced rejection above $10,219.14, trades under selling pressure
Bitcoin is going through a rough patch at the moment against U.S.Dollar as its price has been steadily dropping since yesterday. The price pullback of BTC has been resonated by the leading altcoins such as Ethereum and Ripple too.
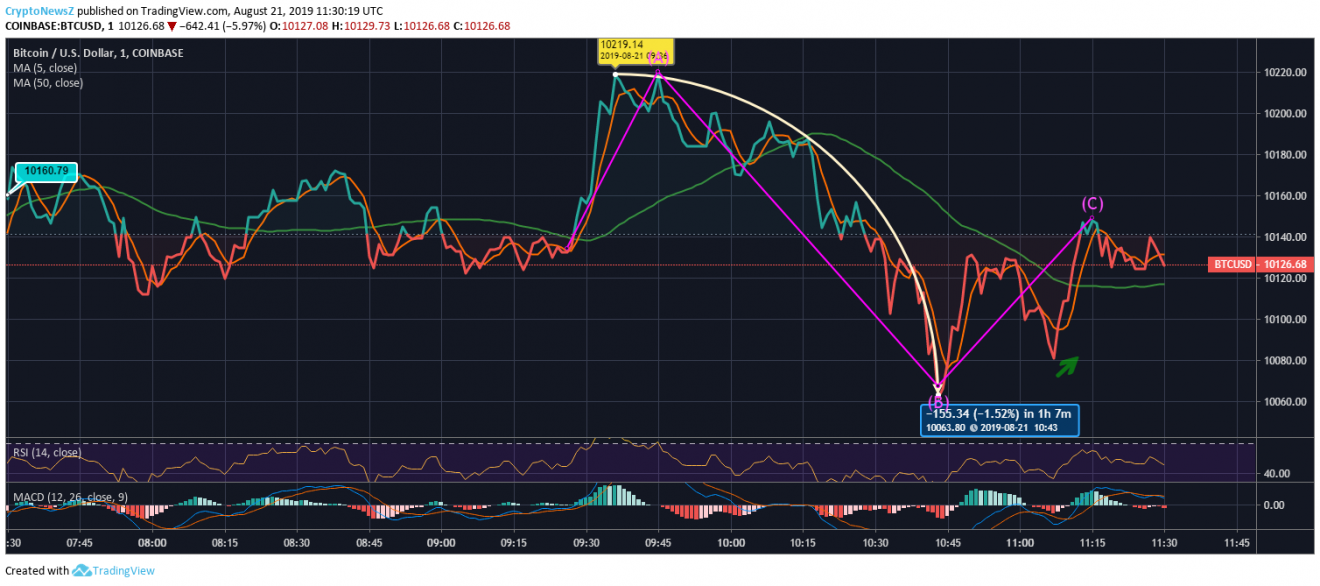
Today, Bitcoin had its opening price above $10,700 which saw a sharp fall below $10,300 and since then the coin has been extending the drop. At 7:30 UTC today, Bitcoin was at $10,160.79 and after a bit of turbulence, it took a surge to $10,219.14. As BTC couldn’t fight the resistance above, it pulled back to $10,063.80 with a price decline of 1.52%. Bitcoin has formed an impulse pattern here.
Bitcoin is correcting up from there at present and is at $10,126.68 at 11:30:19 UTC.
BTC/USD Price Chart
Today’s price slump has pulled the Bitcoin price below its 50-day SMA of $10776.05. The leading crypto coin is even below its 5-day SMA of $10477.21. However, the long term SMA line of the coin is below its short term SMA line which points out to the bullish price move. According to the Bitcoin future predictions, we predict BTC is likely to bounce back soon.
Bitcoin Price Prediction & Technical Indicators:
MACD chart of Bitcoin is in positive zone but it just had a bearish crossover. RSI for the coin is around 50 showing no extremities. Bitcoin may face resistance at $10,933.86 and $11,104.49.


