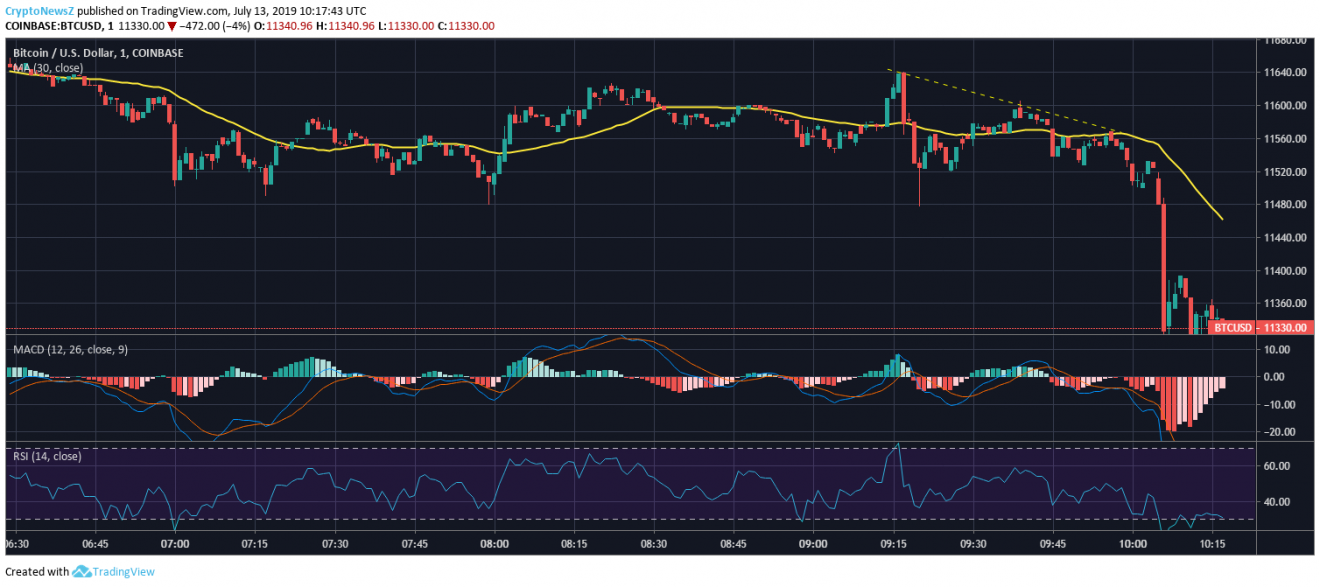
Bitcoin Price Analysis: BTC Price Dips Even Below $11500

- BTC price breaks below $11500, finds support above $11300
- MACD currently indicates bearish momentum with moderate volatility
- RSI stands at 30, showing oversold momentum
Crypto world may see this week to end on a weak note as its leading coin, Bitcoin seems to have a pale time. Since a couple of days, BTC is failing to see a price rise. The coin is well below $12000, and recently it has even broken below the critical support level of $11500, within only 4 hours.
Bitcoin Current Statistics:
At 10:07:37 UTC, Bitcoin was trading with its price at $11330.00. The coin holds $203,404,950,885 in its Market Capitalization and 17,815,075 BTC as its Circulating Supply. Bitcoin currently fetches 8,338.71% of RoI (Return on Investment).
BTC/USD 4-Hour Price Chart
 4 hours ago, BTC price was at $11,644.11 and it remained above $11,500 till 10:02 UTC. Then it sharply fell at $11,332.66 and corrected at $11390.34. It even tested support near $11,284 and again corrected at $11,330. The coin is struggling to cross $11,400 price mark, though faces strong resistance above $11,300.
In the last 4 hours, BTC has shown a price decline of 2.69%. The current price of Bitcoin is 5.28% lagging as compared to its 30 days SMA of $12002.71. The current bearish price scenario has made the coin face selling pressure. Visit our predictions for Bitcoin page to get an in-depth review of the coin.
Technical Indicators:
MACD for BTC is moderately volatile and is having the MACD line below the Signal line. RSI also indicates oversold momentum as it is at 30. Bitcoin may see major resistance at $12,087.94 and major support at $10,907.19.


