Bitcoin Price Oscillates in the Range of $10,000 to $11,000; Facing Resistance Around $10,700

- Bitcoin after having traded above $11,000, is now oscillating in the lower range below $11,000.
- Although in this range after having a fall near $10,300, Bitcoin has gained over 5% in no time since yesterday.
Bitcoin price has been trading with unpredictable numbers wherein the traders would have gained with the 24-hour high ($10,947.04) and yesterday’s low price ($10,313.20). Bitcoin’s persistent trade above $10,000 is good but the coin has enough potential to have the best outcome and trade with even greater figures. According to Bitcoin future price, the 7-day high price ($11,290) shows that BTC has been down-trending right now but will soon be back on track with total potential. And therefore, this BTC price pullback stage is expected to be temporary.
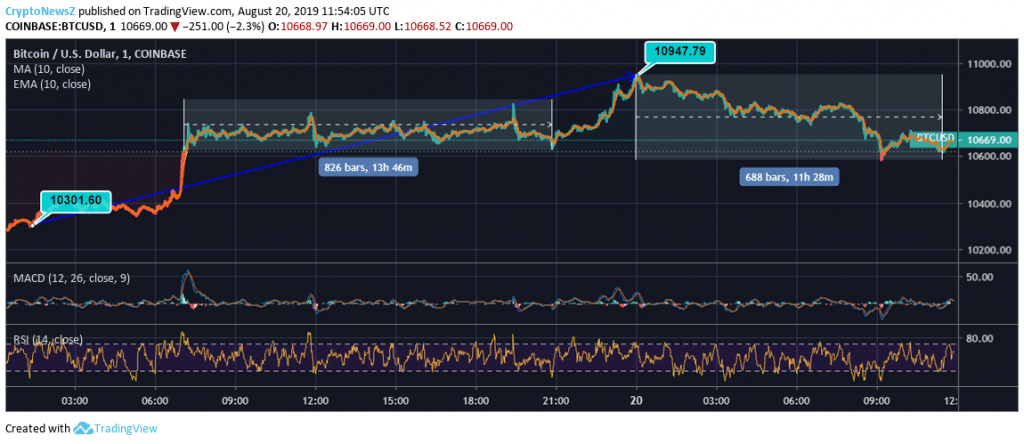
BTC to USD Price Chart by TradingView:
The Bitcoin price chart is a data feed from Coinbase as on 20th August at 11:54 UTC.
BTC Price Comparison:
As observed from the 24-hour chart, Bitcoin price was trading at the lowest $10,301.60, yesterday around 01:15 UTC. At onset of 20th August, the price rose as high as $10,947.79 by over 5%. Also, important to note that the coin has been hovering around $10,600 and $10,700 to a greater extent in the said trading duration. Therefore, the coin is facing major resistance at $10,700 to possibly and persistently trade above the same for a bullish crossover. Today the price of Bitcoin has been trading with a slight downtrend and then appears to be flat trading at $10,669, until the time of penning down.
Technical Indicators:
The current trading is price is slightly more i.e. 0.11% by the coin’s 10-day SMA ($10,656.88) and negligibly less i.e. 0.06% by the coin’s 10-day EMA ($10,675.58).
The BTC price just had a slight bullish crossover of the MACD line above the signal line.
The RSI of the coin returns from the overbought region and currently remains below 80.


