Bitcoin Price Ranges Between the Major Support and Resistance Area

- Bitcoin’s 5-day MA sticks around the current price trend
- BTC price moves away from the major support level at $9,000 after having pushed hard from around $9,000 and $9,200
- The RSI of BTC/USD faced an overbought point above 70 for the major extent of the said time frame
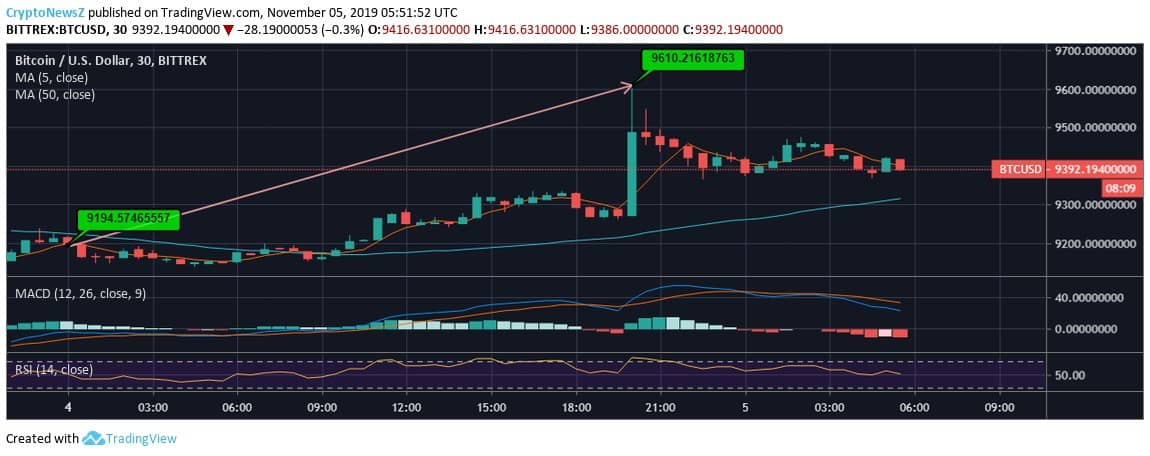
As per the 24-hour data feed from Bittrex, BTC climbed from $9,194.57 to $9,610.21 by 4.52%. As per the candle formation, the major extent of the price trend throughout the said time frame is green exhibiting the ‘strong buy’ phase. The current trading price remains the most visited by the coin and waits for a defined push beyond $9,500 to have a continuous trade. Get more details to know more about the future predictions for Bitcoin.
Bitcoin Price Analysis:
 The 24-hour BTC/USD movement has been quite subtle and gentle as it rose by over 4%. This move has rightly given a sigh of relief from an expected drop below $9,000 to quickly getting away towards the major resistance. The current price of Bitcoin is 2.26% lesser and 2.14% more than the highest ($9,610.21) and the lowest ($9,194.57) of the said time frame, respectively.
Important to note that the short-term MA (5-day) is the grounded support for the current price movement at $9,299.71. However, the long-term MA (50-day) is notably below at $8,690.98, providing support if in case the price breakouts in the opposite direction.
Technical Indicators:
Resistance Levels: $9,500 and $9,700
Support Levels: $9,000 and $8,600
According to Bitcoin price forecast, the MACD of the coin is rightly above zero, wherein we foresee the signal line and MACD line to have a meetup soon.
The RSI of BTC to USD rests at 50 with having inclined towards the upper end (overbought region) at 70 for the major extent.


