Bitcoin Pulls Backs from $10.9 to Trade Around $10.7k in 24 Hours

Markets have been undoubtedly volatile over the past few weeks and the largest cryptocurrency by market capitalization—Bitcoin continues to consolidate below $11,000. Moreover, it was over the past 2 hours that the coin has crossed above $10.9k but has corrected downsides and currently trades around $10.7k. Alongside, as we near the close of the most volatile quarter, we see that the price of BTC has been consolidating below $11k which appears as a rhyme just when the foremost crypto kept accumulating below $10k.
Moreover, Bitcoin is surrounded by sentiments such as the coin breaching and marking a fresh All Time High above $20k before the end of the year. And as per the YTD growth of BTC/USD, it will be not be an understate to not project a new ATH. But not forget that the markets are very volatile at the moment and the investors have been shedding their farfetched gains. However, the best time to invest and HODL is now. For further speculations, just go to Bitcoin price prediction to know all BTC Price updates for upcoming months/years.
Bitcoin Price Analysis:
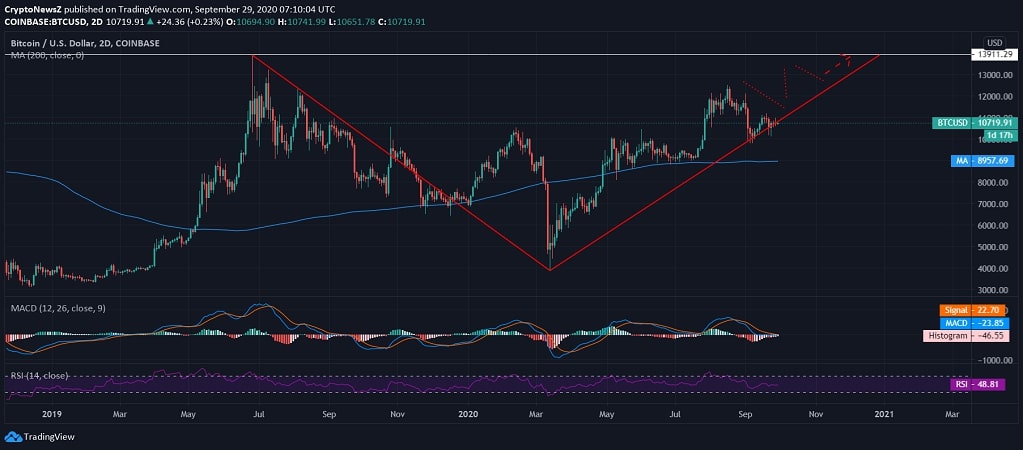
 Bitcoin’s 21-month movement against the US Dollar has been drawing a probable V-shape pattern on the 2-day chart. If the coin confirms the similar pattern that we project, it is likely to trade above 2-year resistance marked at $13.9k. On the same 2-day chart, BTC/USD retains complete support from 200-day MA around $8.9k.
However, on the same 2-day chart, the MACD exhibits a clear bearish crossover and therefore, the signal line is seen crossing above the MACD line. The RSI of the coin is at 48.81 and holds no extremities at present.
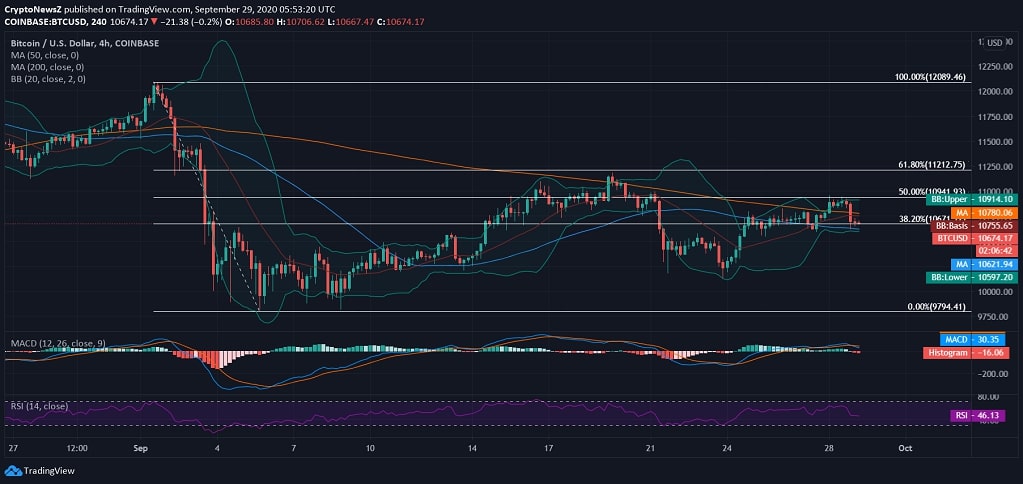
 If we emphasize on the 30-day movement of Bitcoin, the price trend of the coin against the US Dollar is seen dropping below 38.20% Fib Retracement Level. With a bearish pull back, the negative candlewick is seen approaching the lower 20-day Bollinger Band. The coin holds support from 50-day MA but lacks support from 200-day MA on the 4-hourly chart.
With intraday pull back from $10.9k to $10.7k, the MACD charts shows a bearish divergence, with RSI sliding from the overbought region to oversold region.


