Bitcoin SV Crosses $110 After 13.14% Hike in a Day

- BSV crosses 110 USD after a 13.14% increment
- The next resistance awaits at 115.29 USD
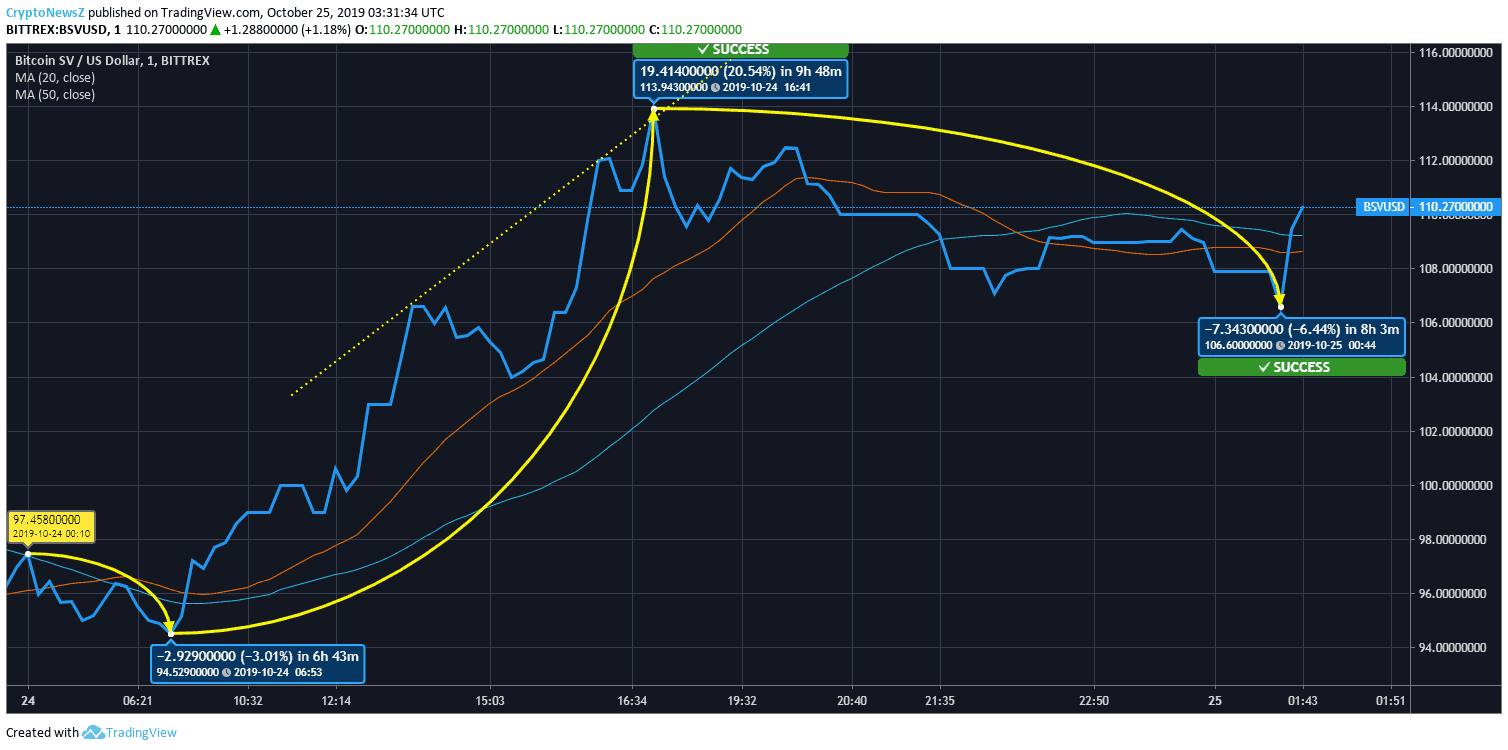
Bitcoin SV has also followed the market trend and in the last one day it mounted up by 13.14% to go beyond 110 USD from 97 USD. It has been through three major price shifts in this period and the range of the swings lies between 94.52 USD and 113.94 USD.
BSV Price Analysis
Bitcoin SV opened the day at 97.458 USD and in the initial 6 hours and 43 minutes, it went on to lose 3.01% to be pushed at 94.529 USD. It was followed by a hike of whopping 20.54% which helped BSV to add 19.41 USD to record the highest point of the day at 113.94 USD. From there it started weakening and by 00:44 UTC today, it lost 6.44% to touch 106.6 USD.
BSV’s market cap also has witnessed a hike in these 24 hours. It was at 1.931 billion USD on October 24 and currently, it is at 2.003 billion USD.

BSV’s 20-day and the 50-day moving average is 92.662 USD and 101.937 USD respectively. The current price trend at 110.27USD is 8.17% and 19% more than the 50-day average and 20-day average respectively. BSV’s next halt may come at 115.29 USD.
| Bitcoin SV (BSV) | Resistance and Support Levels |
| 1st Resistance | $115.29 |
| 2nd Resistance | $123.69 |
| 3rd Resistance | $133.91 |
| 1st Support Level | $96.67 |
| 2nd Support Level | $86.45 |
| 3rd Support Level | $78.05 |
Learn more about the long-term potentials of the coin through Bitcoin SV price prediction by experts.


