Bitcoin’s Recent Pullback and Price Reactions of XRP, ETH, BCH and LTC
- Bitcoin loses gained momentum over the last two days, ranges between $11000 to $12000 after its rally above $13000
- BTC Price downturn heavily impacts rest of the crypto market, XRP suffers the most
- Ethereum moves below $300 from its 3-month high price of $361.40
- Bitcoin Cash is currently recovering losses, as it had bottomed at $386.95 after soaring high above $500
- Litecoin price trend goes through a bearish vibe, trading below $120
The previous week for Bitcoin has been quite a heady one looking at its price path. The exciting price surge above $13k and the following pullback has shaken the crypto-market to quite an extent. Notably, Bitcoin is facing a downward correction since 27th June, the leading crypto coin had sharply dropped to $12349.39 from its 52-Week High price of $13,796.49. Bitcoin is heading towards its psychological support price of $10000 if it falls rigorously.
Bitcoin (BTC):
BTC price saw two consecutive and massive bull runs within a couple of weeks. Due to the first bullish surge, it was already trading above $10000. The recent price rally caused it to climb above $13000 on 26th June clearing major resistances. On the same day, the Bitcoin price sharply pulled back below $12000. BTC further tumbled even below $10500 breaking major support level near $11,400. BTC, since then, has been tracing a price rebound having key support at $10305.00.
At 06:02:19 UTC, Bitcoin was trading at $11481.52, which is 15.54% higher than its 20 day SMA of $9936.42 despite recent price decline.
As BTC has started to move upwards, currently Bitcoin is in the ‘BUY’ phase, though it is anticipated that, to trigger further surge, Bitcoin needs to maintain its price above $12000. However, you should know more about Bitcoin price prediction and the chart patterns before you choose to do anything.
Bitcoin 5-Day chart
 MACD for Bitcoin is moderately volatile, while it shows a bullish price move as the MACD line is above the signal line. Moreover, RSI for BTC/USD is below 50 indicating no extremities. If BTC continues to recover further, it may see resistance at $12,930.18 and $13,453.02, it can see support levels at $10,391.64 and $9,868.8 otherwise.
Ripple (XRP):
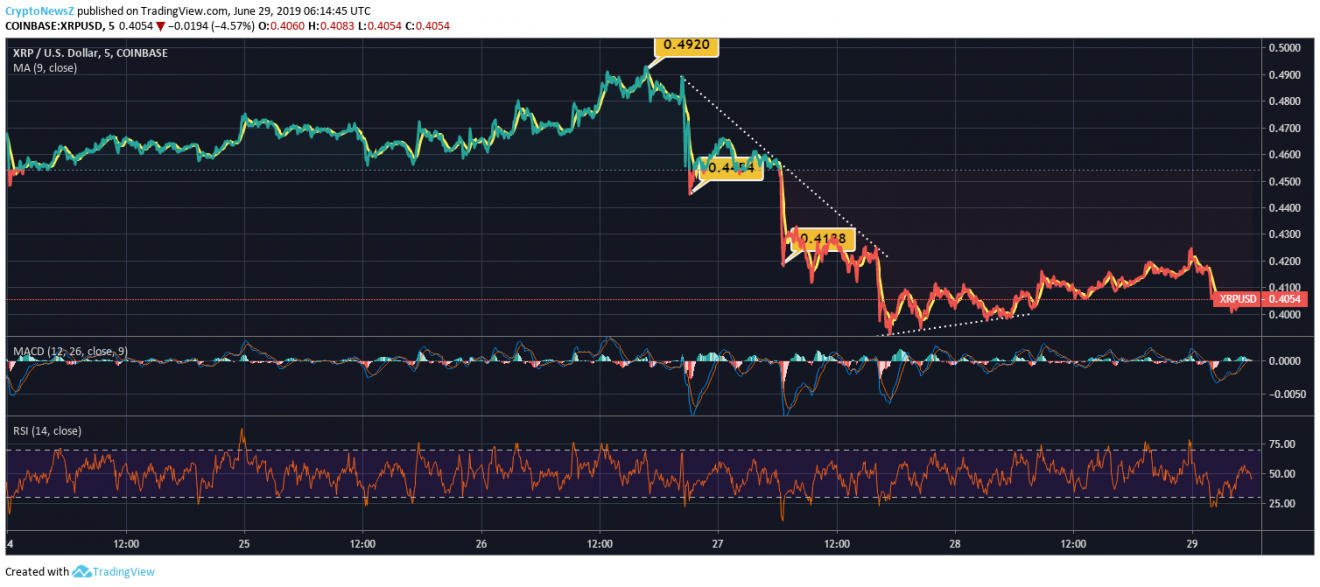
Ripple has become a notable victim of the recent Bitcoin price decline. XRP saw a steep decline from its price above $0.49 to its critical support price near $0.4454. The crypto coin failed to stay above the support level and again dropped even below its two major support levels ($0.41 and $0.40) and bottomed at $0.3926. It has corrected upwards since then but is yet to break out above $0.41.
At 06:14:45 UTC, XRP was trading at $0.4054 which is 8.87% lower than its 10-day SMA of $0.4449. It appears that XRP needs to surge stably above $0.42 in order to step out of the bearish impact.
XRP 5-Day Price Chart
 Ripple’s MACD chart shows similar moves as that of Bitcoin. Also, its MACD indicator is yet to enter into the bullish zone. RSI for XRP/USD is at 45 which signals to the slight oversold impact on it. An uptrend in XRP can take it to the resistance levels at $0.4361 and $0.4449. While it can see support levels at $0.3933 and $0.3844 if the price moves downwards.
Ethereum:
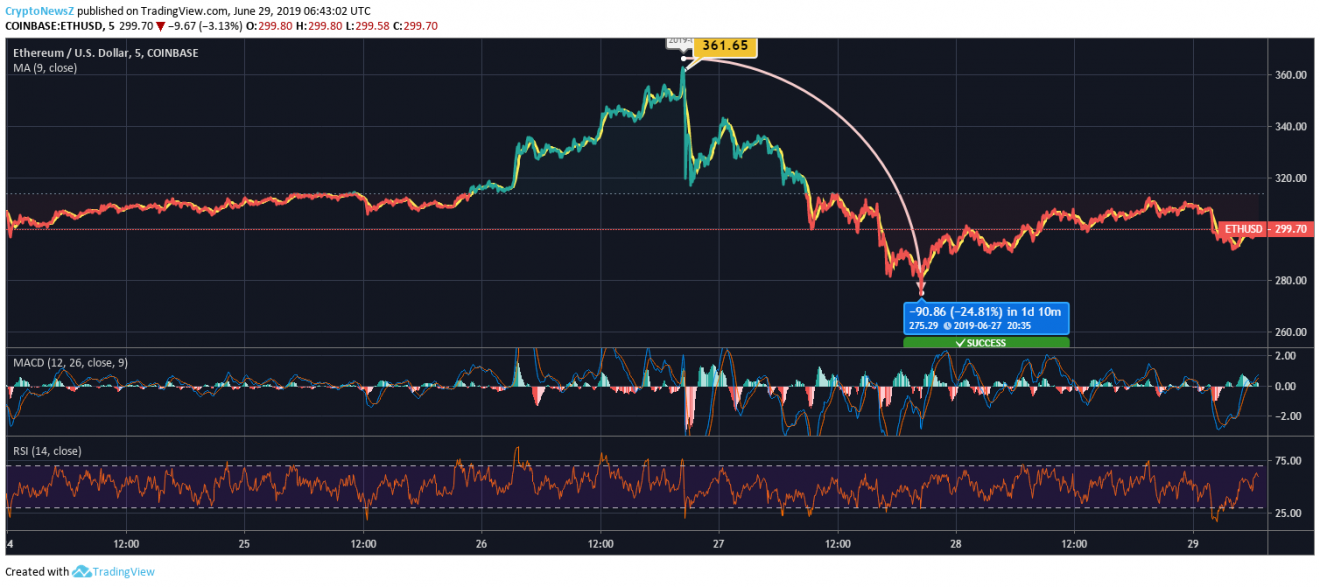
BTC’s recent price rally caused ETH to surge above $366 and the following pullback made it tumble well below its major support level of $290, with a decrease of 24.81%. ETH price is currently recovering the loss as the coin is above $290 but is struggling to reach above $300.
At 06:43:02 UTC, ETH has its price at $299.70. Despite the fact that the coin has struck a notable price recovery since the drop, it is currently 3.55% lower than its 5 day SMA of $310.76.
ETH 5-Day Price Chart
MACD for Ethereum not just appears moderately volatile but is also indicating a bullish crossover at present, as the MACD line is above the signal line. Meanwhile, RSI for ETH/USD is quite near 70 which shows overbought momentum at this point of time. Price rise in ETH may face resistance at $318.53 and $325.82, though a price fall can take it to the support levels at $285.64 and $278.35.
Bitcoin Cash
BCH price was trading between $400 to $470 till the recent Bitcoin surge above $13k. BCH after the rally had soared to $516.58 and it gradually decreased as low as $386.95, breaking major support above $400 with a decline of 25.09%. BCH has started to move upwards from there and has cleared resistance near $400.
BCH price is at $418.77 at 07:00:23 UTC. The price at present is 7.37% lower than the 10 day SMA of BCH ($452.09), which indicates the current bearish trend in Bitcoin Cash.
BCH 5-Day Price Chart
 The MACD chart appears less volatile now, signalling a bearish trend. The RSI for BCH/USD is heading towards 70 indicating upcoming overbought phase for the crypto coin. BCH may see resistance at $450.45 and $464.09 if it strikes a surge, while at $412.33 and $387.85 it can see strong support.
Litecoin:
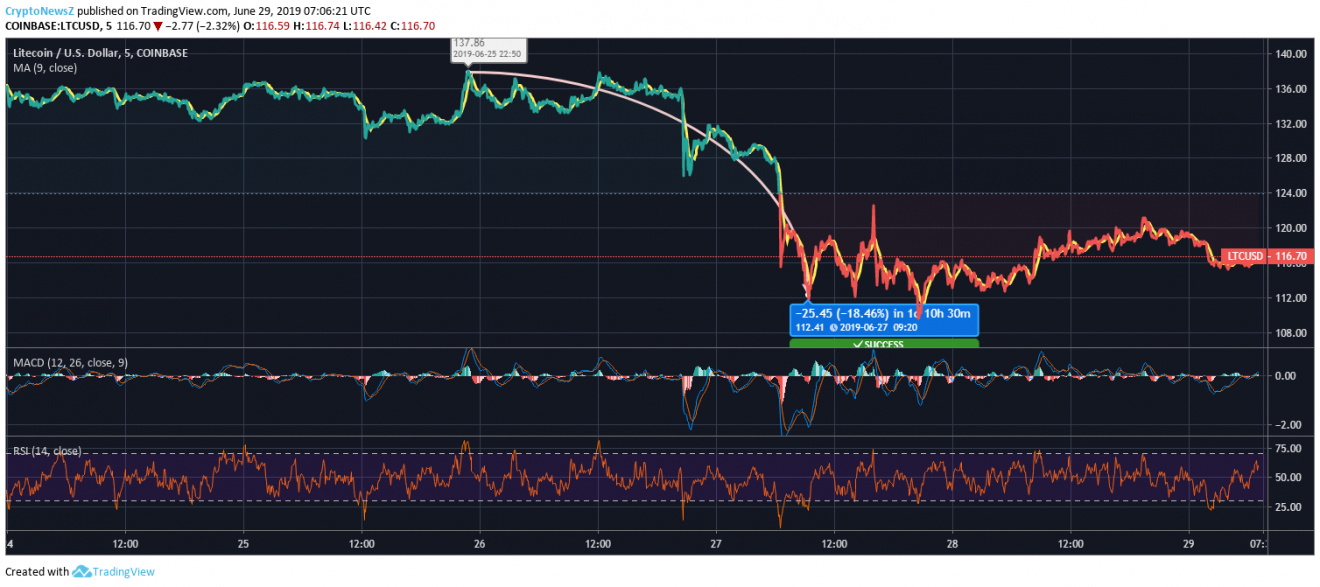
The LTC price chart shows a downward price shift. The coin was as high as $137.86, from where it dropped to $112.41 with a price decrease of 18.46%. The LTC price further tumbled at $109.72 having its 7-day low price. Here, LTC has traced an upward correction and is currently attempting to strike a strong price rebound.
As it is heading towards a price recovery, LTC is trading at $116.70 at 07:06:21 UTC. The current price of LTC is lagging behind at 12.26% compared to its 20-days SMA of $133.01.
LTC 5-Day Price Chart
 The MACD chart for LTC currently lacks volatility, while RSI for LTC/USD is quite close to 70, signalling to upcoming overbought momentum. If Litecoin manages to cross the price barrier near $120, it may face resistance at $123.62 and $127.10. It will see support prices at $115.07 and $110.00 if the price drops.


