BNB Shows Contradictory Trends in the Past 24 hours

Binance coin was noticed to be underperforming in the last 2 months, ranked amongst the top 20 coins. But how is it affecting the traders’ portfolio is a bigger concern here.

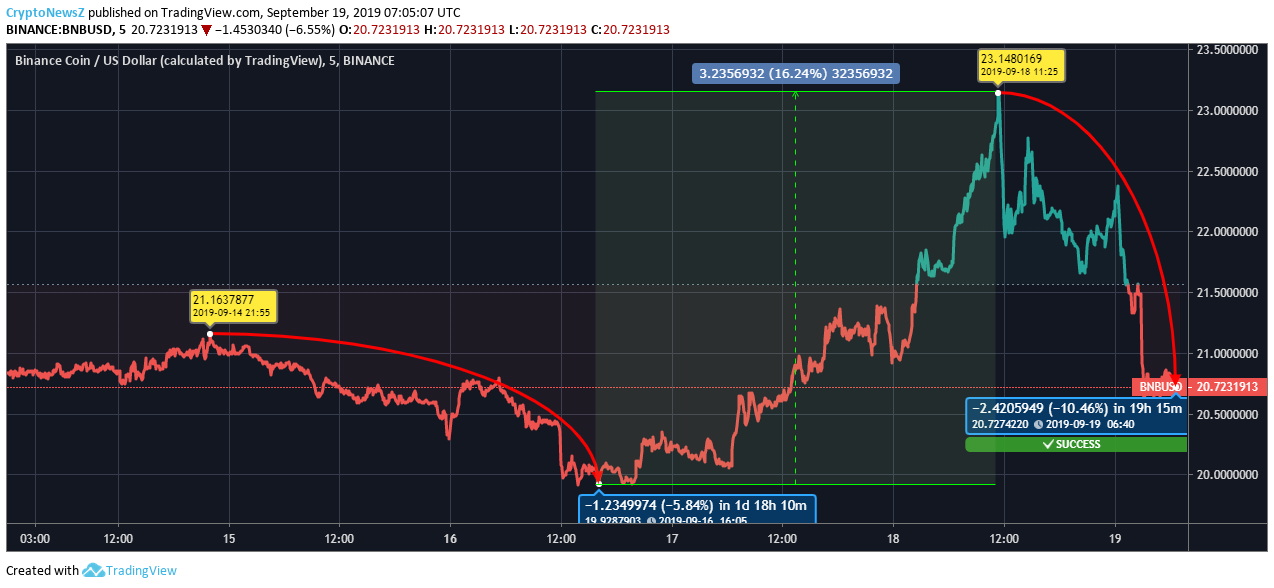
Considering the data from the past 5 days, Binance Coin was initially trading below the baseline at $21.163 as on September 14, 2019, at 21:55 UTC. Further, the price dropped by 5.84% as of September 16, 2019 at 16:05 UTC trading at $19.928.
A tremendous escalation was realized when the value increased by 16.24% as of September 18, 2019 at 11:25 UTC when BNB was trading at $23.148. This was noted to be the highest touchpoint in the last 5 days. However, the current value has dropped by 10.46% from the latter price mark.
BNB is fluctuating in the bearish zone right now and seems to have had a steep drop lately.

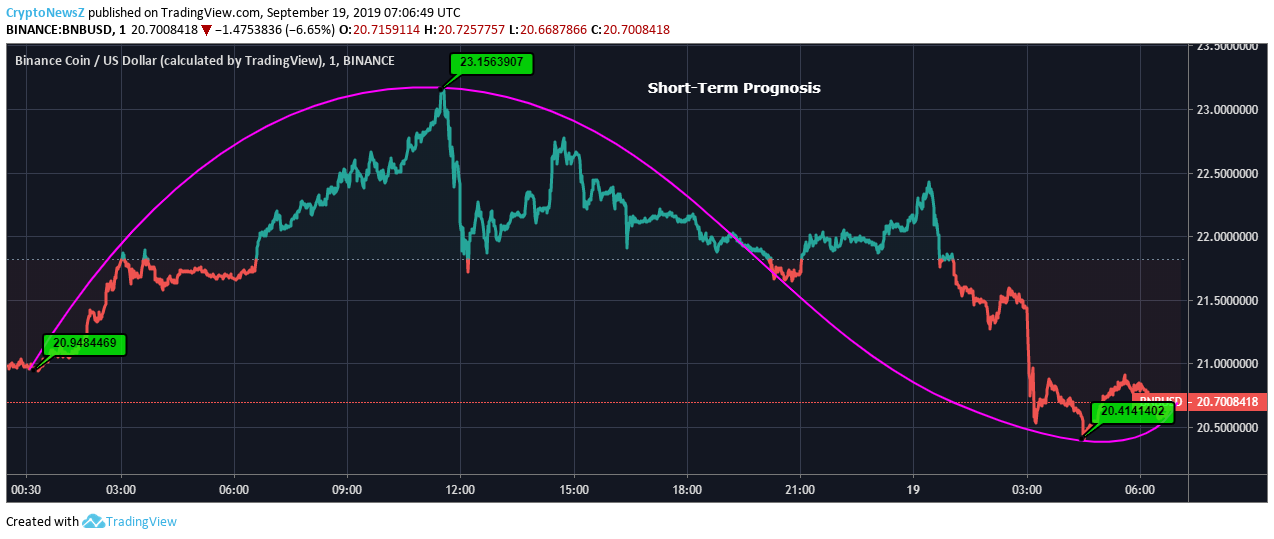
Considering the short-term movement, the value witnessed some tremendous escalations, but today, it has dropped below the baseline again. The short-term movement can be profitable for the traders if the buy/sell decision hits on the correct point.

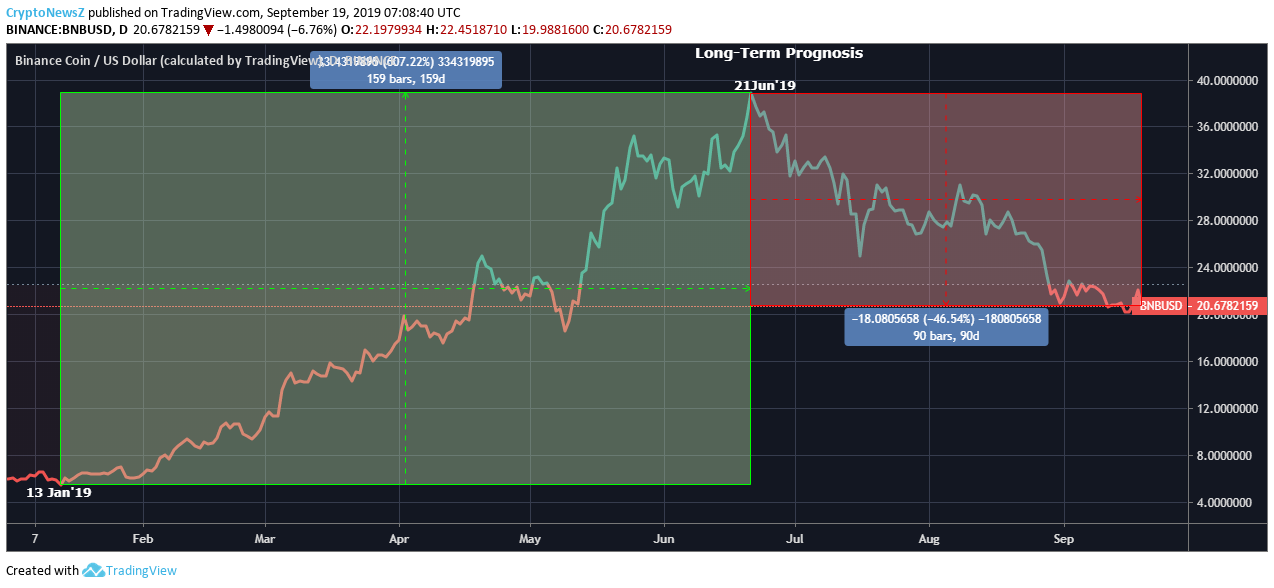
If we look at the long-term movement, on the other hand, BNB is fluctuating in the moderate bearish zone. After the highest touch point seen on June 21, 2019, the value has witnessed a constant drop in the chart. However, according to our Binance Coin Prediction, the currency might be in same situation for some while.
Irrespective of short-term or long-term movement, the resistance and support level is calculated as follows:
Resistance Level:
R1: $23.1, R2: $23.95, R3: 24.99
Support Levels:
S1: $21.21, S2: $20.17, S3: $19.32


