Cardano Price Analysis: ADA Continues a Downtrend, Seeks Decent Support

- Cardano price trend was bullish for the last couple of days; witnessing a fall since today morning
- ADA coin has recently broken below $0.048, heading towards further lows
- Cardano has traced a bearish trendline, which may pose as a resistance
Cardano coin was having a bull-run from 18th August and today, it seems, it is going to take a break. The coin has started a downward price move against U.S.Dollar recently, and it needs a strong support level to come up with a price recovery.
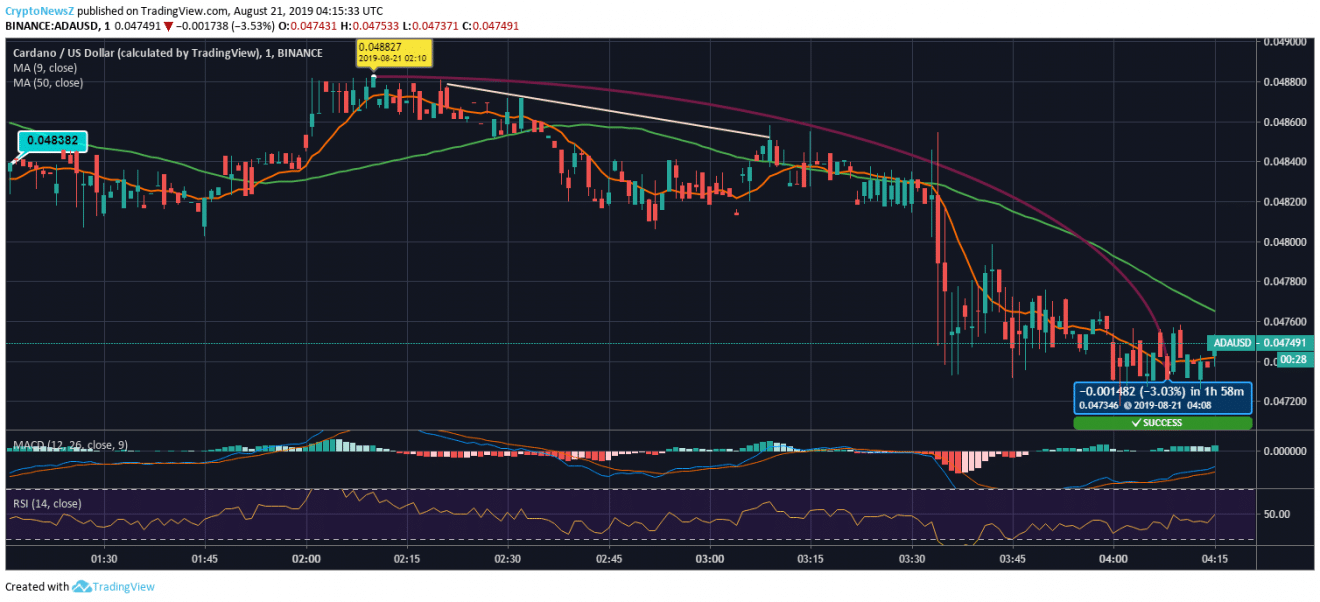
Cardano was trading at $0.0483 today morning. After tracing a low swing near $0.0480 the coin soared to $0.04882 but could not go beyond. Since then, ADA price has been declining and it even traded below its key support level of $0.048. The coin also had a dip near $0.04734 with a decrease of 3.03% from its high point of $0.04882. After a bit of upward correction, at 04:15:33 UTC, Cardano is trading at $0.04749.
ADA/USD Price Chart by TradingView

Cardano’s current price is 20.17% lower than its 50-day SMA of $0.05949, also, it has traded below its 5-day SMA of $0.04912. ADA’s long term SMA line (50-day) is above the short term SMA line (5-day), which shows its bearish momentum. The coin is trading under selling pressure.
Notably, yesterday morning the Cardano price was above $0.050, and today the coin is heading to cross $0.047, which shows how the price is rapidly dropping.
Cardano Price Prediction & Technical Indicators:
MACD for the coin is lowly volatile and is bearish zone, though with its MACD line above its Signal line. RSI of Cardano at 50 showing no extremities. ADA coin may face resistance at $0.0500 and $0.0509 and support at and $0.04713.


