

Dash, at the time of writing, was trading at $54.78 after having soared at $64.43 just a few days back. The coin trades with ultimate support from the daily moving averages and therefore, can be believed to be reliable. Important to note that the current uptrend has rightly gained 200-day support.
The king of the cryptocurrencies and all the major altcoins of the market are seen drawing bullish crossovers in the market.
Dash Price Analysis
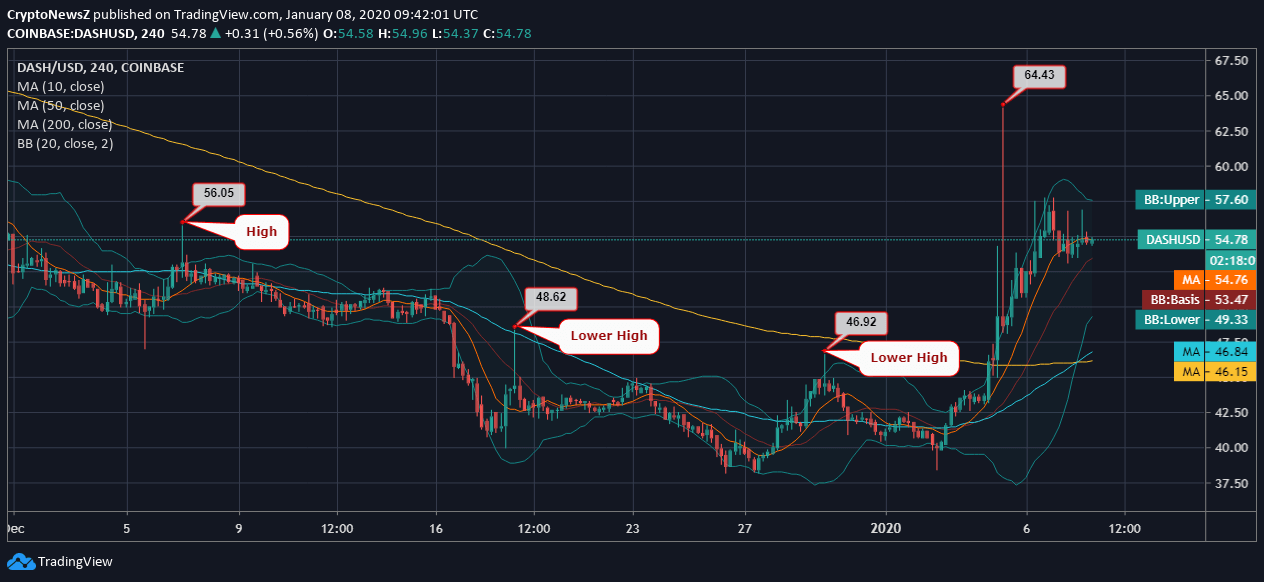
Analyzing the DASH/USD price analysis on Coinbase, we see that the coin had been recording a downfall in the last two months of the bygone year. It was just in the previous month when the Dash price trend marked the lower highs after trading around $56. While the coin was breaking through the 20-day lower Bollinger Band, it lacked active support. A sudden temporary candlestick breakout at $64.43 has marked a fresh 30-day high.
Related: Check Dash coin price prediction
Presently, the coin is seen consolidating around $54. The laid 20-day Bollinger Bands are seen widening, which may welcome volatility in the upcoming days. The current trading price is strongly supported by the 10-day daily MA, followed by a 50-day and 200-day MA.
Technical Indicators
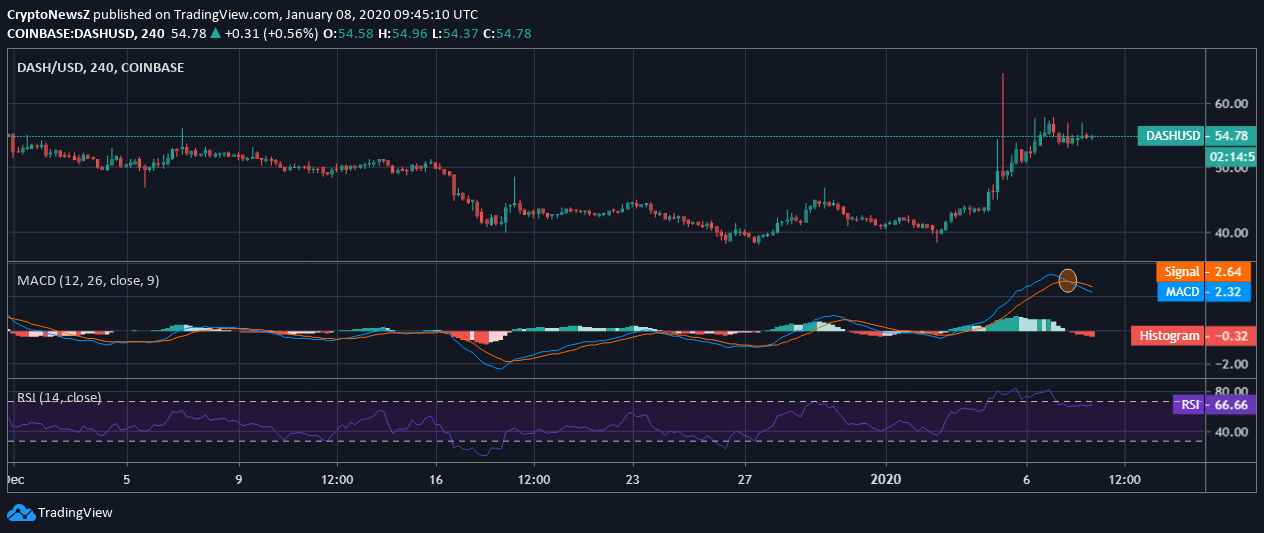
The technical Indicators laid exhibit a controversial picture as the MACD of Dash is running above zero but holds a bearish crossover as the currency is seen correcting downwards from the 30-day high.
The RSI of the coin is at 66.66 and is inclined towards the overbought region.