Dash (DASH) Price Analysis : DASH’s Market is on a Complementing Development

Dash- a portmanteau of DIGITAL CASH is an open source cryptocurrency and is a form of decentralized autonomous organization whose digital currency is privacy-centric with respect to instant transactions. This is run by a subset of users called “master nodes.” Dash’s fascinating incentives based peer-to-peer networks makes it more workers friendly too, where miners are recognized and rewarded for securing the blockchain and master nodes are rewarded for validating, storing and serving that blockchain to the users. It, also, put together another technology called IntantX- when the users send the funds, the transactions will be fully sent and is irreversible within four seconds. It was launched with zero premine coins.
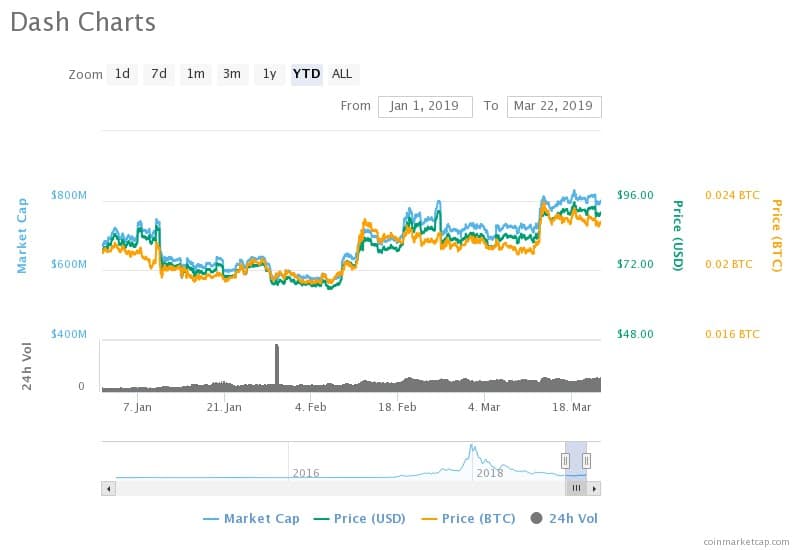
Based on the reports from CoinMarketCap, DASH is ranked as the 15th cryptocurrency with its market cap value as USD 797,571,685 on March 22, 2019 at 16:04 for the trading 24h volume of $366,499,572 which is comparatively lower by 6.74% from the value of $747,224,741 USD on February 22 at 16:39 UTC. The overall market has been on an uptrend with substantial highs and inconsequential lows. However, the market was down for a month between January 10 and February 10, with its lowest on February 06 with its MCap value – USD 565,358,516. Nevertheless, the current value shows that the market hiked 41.07% high since then. The 20-day Exponential Moving Average is in support of market’s uptrend, with its values boosting from USD 723,966,035 on March 02 to the current value by 10.17%. The bulls are pressuring the overall market and the 20-day EMA. Click here and read our forecast section to get Dash forecast by experts for upcoming years’.
Current price value of USD and BTC are $91.65 and 0.02273039 on March 22 at 16:04 UTC. Both the prices of BTC and USD are fluctuating with its immediate highs and lows. Along with MCap value, the BTC and USD values reached its peak on February 24 with values of $93.33 and 0.002385374 which are closer to the current values with a negligible percentage difference between them. The market trend shows that both the price of BTC and USD and the MCAP values have been completely overlapping each other from the beginning of 2019. Bitcoin’s prices have been majorly range bound, and the values have been wavering between 0.0021 and 0.0023. However, the extreme prices were- the highest crossing 0.0023 and the lowest falling below 0.0020 at 0.01929051 with the average difference of 15.13%. The currency reached its milestone between USD 81.91 on March 11 and USD 93.33 March 13, with a 13.94%hike in the USD pricing within 02 days. The traders must explore the trend and contribute, which would drastically increase the value of the cryptocurrency.
The moving averages are in terms of the market’s progress. While, the 20-day EMA show an uptrend with the percentage increase of 10.17%, the 14-day moving average shows a difference of 10.24% growth from USD 723,463,097 on March 08. The significant positive increase of the percentages of the moving averages falls in favor of the bullish pressure, and hence the market balance falls in favor of the buyers. The traders with the short term investment will increase the value of the market of the cryptocurrency and stabilize it in the future. The investors with long term investments, the current market is already suitable for their investment plans.


