

- Dash loses 0.7% in the last 24 hours to touch $65.64
- It is likely to find the next resistance at $69.33
DASH coin has played neutral over the last 24 hours as far as its overall price trend is concerned. However, in these 24 hours, it has shown three major price shifts, and it is down by 0.7% over the last one day. Let’s move on to Dash Prediction
Dash Price Prediction
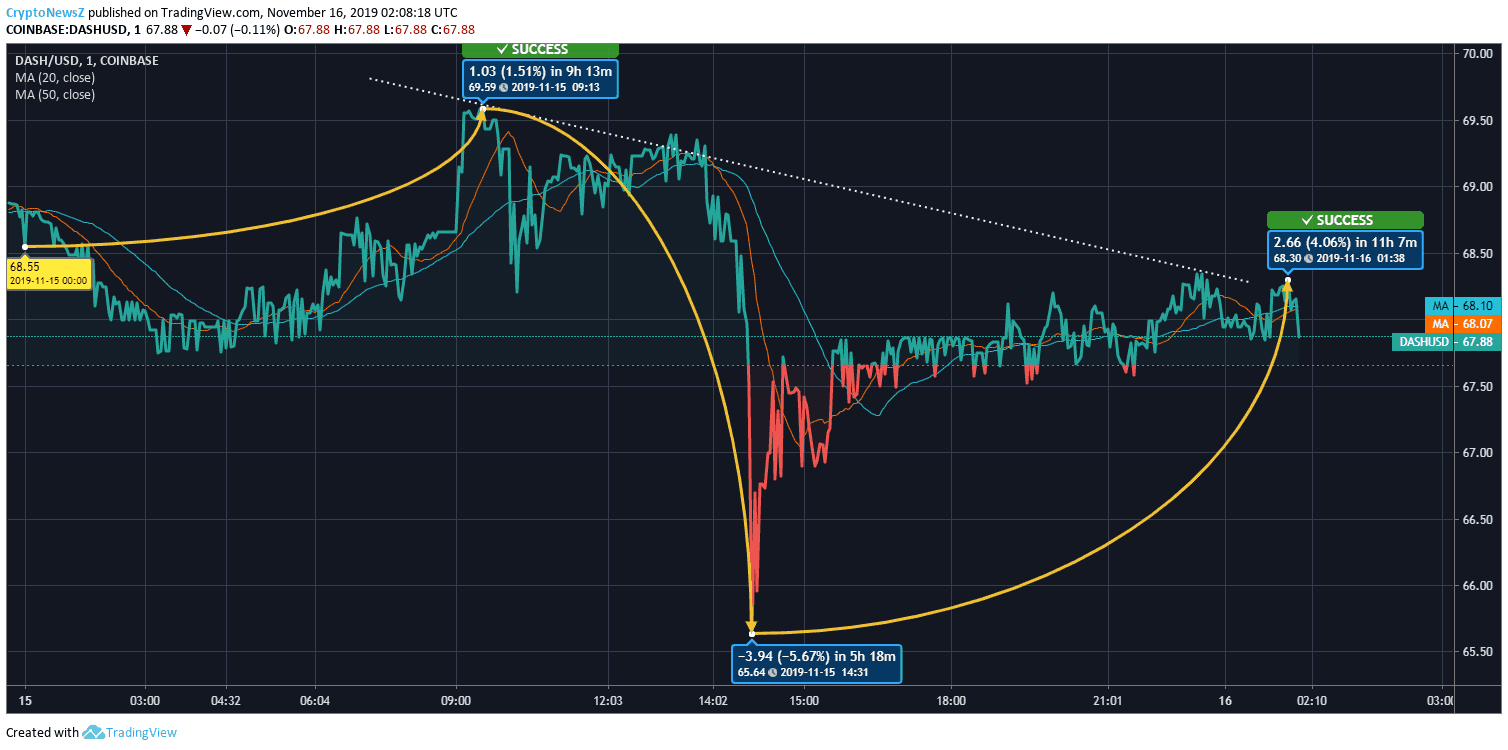
DASH coin’s first variation happened over the initial 9 hours and 13 minutes, and in these hours, it got a 1.51% hike to touch 69.59 USD, the highest for the day. From there, it showed weakness and reached 65.64 USD by 5.67% slump at 14:31 UTC. Then, it shown some signs of strength and got a hike of 4.06% and scaled the Dash price as high as 68.30 USD.
The market cap of DASH, however, has shown an increment in these last 24 hours, and between November 15 and 16, it has risen to 625.101 million USD from 624.491 million USD.
Dash has its 20 days average at 68.07 USD, and it’s 50 days average now stands at 68.10 USD. The current price of DASH coin is 67.88 USD is 0.32% and 0.27% less than the 50 days and 20 days moving averages, respectively. The next resistance is likely to fall at 69.33 USD.
| Dash (DASH) | Resistance and Support Levels |
| 1st Resistance | $69.3333 |
| 2nd Resistance | $70.4566 |
| 3rd Resistance | $71.4133 |
| 1st Support | $67.2533 |
| 2nd Support | $66.2966 |
| 3rd Support | $65.1733 |