DASH Surges as the Market Gets the Boost; Short-term Seems Profitable

DASH recently partnered with Coinbase Pro with a limit of offers available on the platform for DASH followers and traders.
Dash trading is already live on Coinbase Pro. Only limit orders for now https://t.co/mJbs4XEpJq
— Dash (@Dashpay) September 17, 2019

Considering the data from the past 5 days, the lowest trading point of the coin was realized on September 13, 2019 at 05:25 UTC, when the value was trading at $84.922. The value of DASH then increased by 11.57% on September 14, 2019 at 00:45 UTC and the trading price was changed to $94.75. The price from then decreased by 7.18% on 16th September at 17:45 UTC, when the coin was seen trading at $87.982.
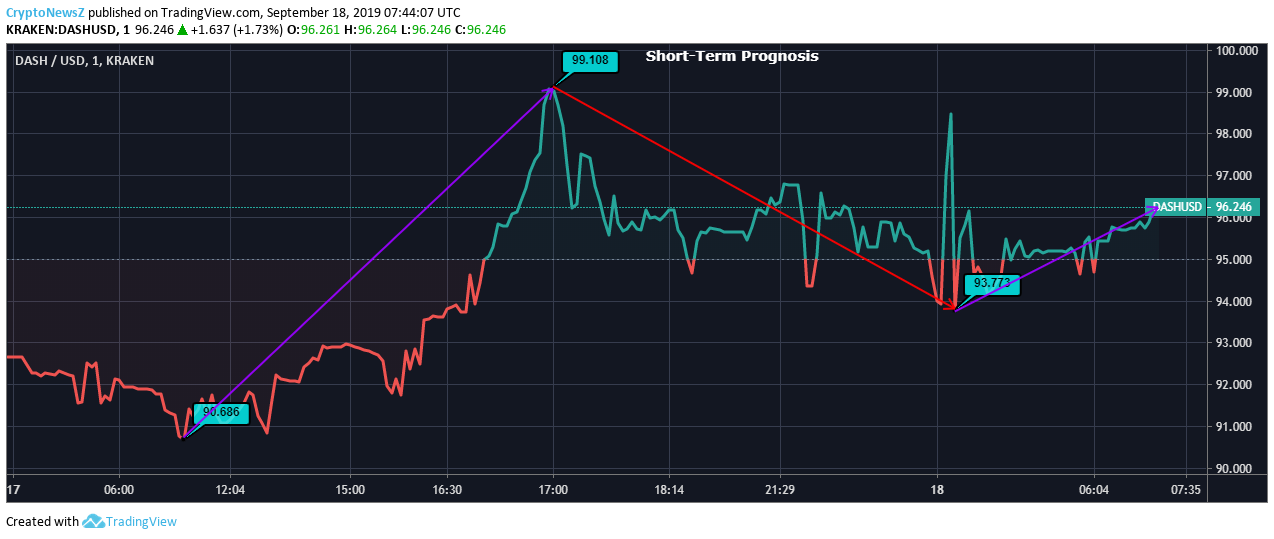
After this, DASH took an astounding leap and the price reached the highest touch down of $98.961 having a growth of 12.48% yesterday at 16:55 UTC. However, the current trading value is dropped by 2.73% from the latter price mark.
DASH is fluctuating at the pivot point, however, more inclined towards the bullish zone. Traders are expected to keep a close eye on the daily analysis to understand the direction of fluctuations. The short-term prognosis is working in the favor of investors to a greater extent when compared with the long-term.

The long term investment, on the other hand is hanging patiently. Traders might want to handle their trade with patient. Even if DASH moves in the bullish zone, it might take some time for DASH to reach above the baseline (for long haul movement). Check Dash Predictions by experts to find more information about the long-term prices of the coin.

Conclusion
To conclude, the short term movement is working in the favor of traders. The little drops can be avoided by the resistance support level as:
R3: 103.4
R2: 100.22
R1: 97.58


