DigiByte Reclaims 2-Year High; Trades Above $0.030

DigiByte (DGB), at the time of penning down this analysis, was trading around $0.032, wherein the coin is now breaching an approximate 2-month high. With this, DigiByte’s 1-week social volume has spurred by 16.6%, according to LunarCRUSH Social Listening. With this, social media posts hit a total of 18,559 as the price spiked by over 20%.
DigiByte 1-Week Social Volume has increased 16.6%, hitting 18,559 posts on @LunarCRUSH as price moved up +20.71%.
View all $dgb social metrics at https://t.co/7JxmnMZ43i #digibyte pic.twitter.com/4Y6dMuhGAi
— LunarCrush (@LunarCrush) August 10, 2020
The speed of transferring DGB coin is immensely high and, therefore, is proving all the worth of being one of the top 50 cryptos of the global market. DigiByte holds a market cap of approximately $400 million and has gained great height this altcoin season.
From trading around $0.00522 to reclaiming a 2-year high, DGB price has approximately gained over 500%. After trading sideways for the first four months of the ongoing year. DigiByte is now the most shilled altcoin.
DigiByte Price Analysis

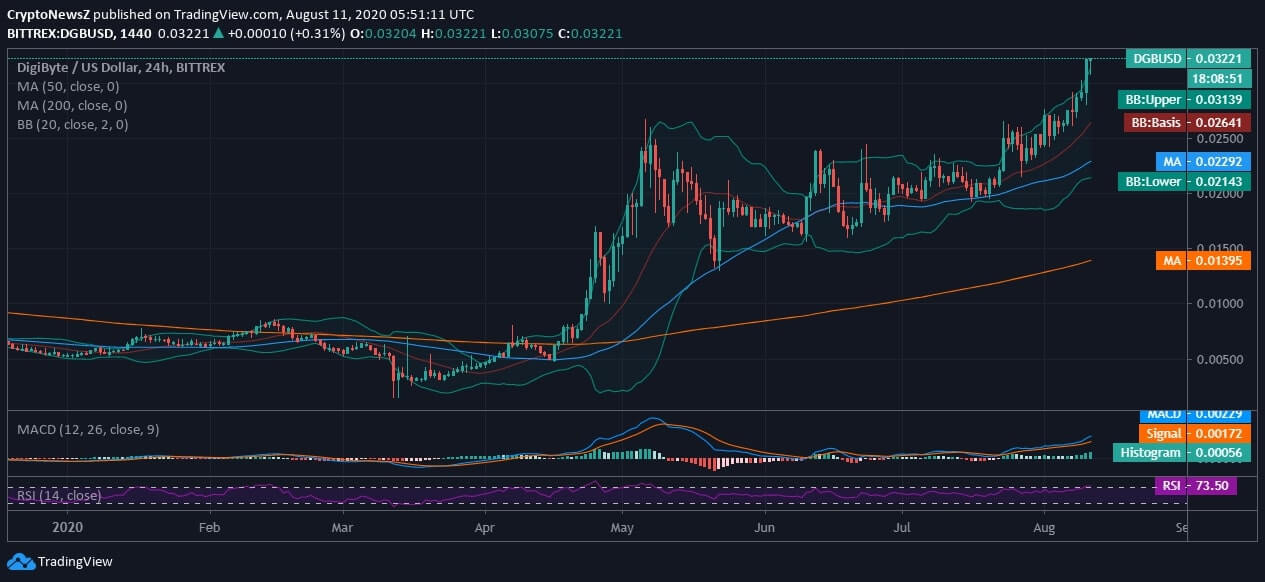
DGB, on a 24-hour chart, is seen trading with utter momentum after the massive sell-off and testing supports as low as $0.00161, and within seven weeks thereafter, it grew over 1500% to hit the first high after slagging at $0.02672.
With yet another higher high, we see the reclaiming a 2-year high recently and is holding support from 50-day & 200-day MAs at $0.0229 & $0.0139. The price trend of DigiByte is already hitting the upper 20-day BB and, therefore, projects moderate volatility as the bands widen slowly.
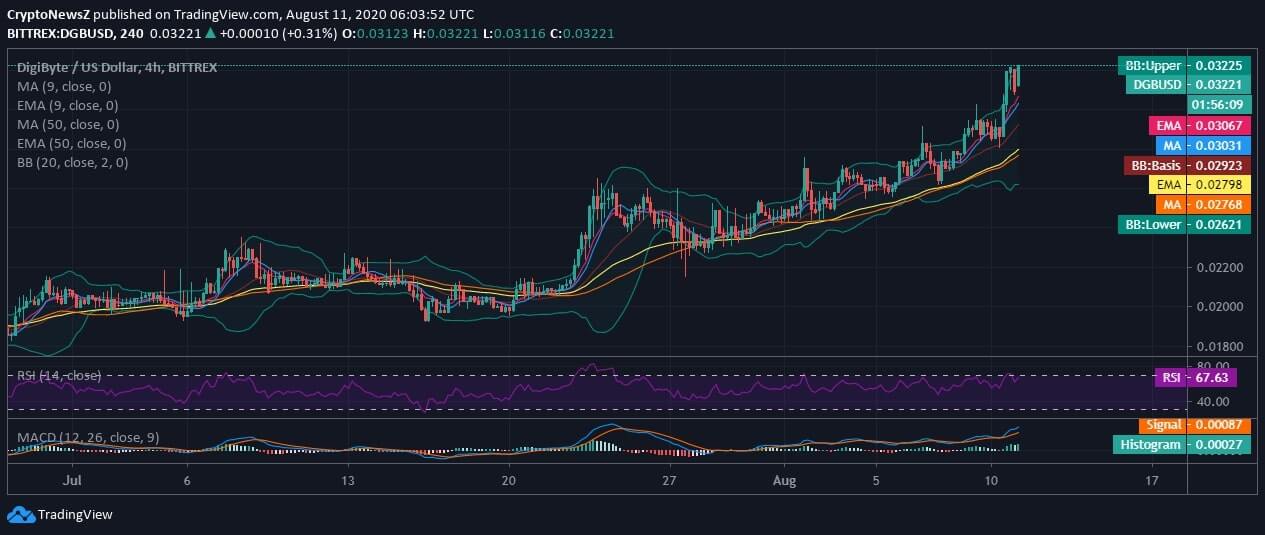
The MACD chart holds a complete bullish crossover on the 24-hourly chart as the intraday holds positive bias, and the MACD line is crossing above the signal line. In this regard, the MACD chart holds a bullish divergence, too, on the 4-hourly chart. With an intraday strong bullish scenario, the RSI in both the time frames is inclined towards the overbought region due to spurring demand.
Alike to DGB/USD movement on 24-hour chart, and as per DGB Forecast, we can see reminiscent of intraday bullishness on a 4-hourly chart as well. DigiByte holds complete support from 9-day MA, 50-day MA, and 9-day EMA, 50-day EMA on a 4-hourly chart that shows immense support around $0.027 and $0.030 price area.


