Electroneum (ETN) Price Analysis : Electroneum’s Unpredictable Change in Trend Delays Progress

Electroneum is a mobile-first cryptocurrency aimed at mass adoption and is built off Monero codebase to allow for transactions on a decentralized blockchain. Electroneum’s one-time public key prevents recipients funds from being linked with their wallet, resolves the security issue. The recipient gets their funds through their wallet’s private view key which scans the blockchain. Transactions are faster with dynamic fees. The more interesting feature is the ability to perform mobile mining through the phone’s CPU. Though mobile mining will not confirm the creation of new blocks, however, rewards will be given to the miners.
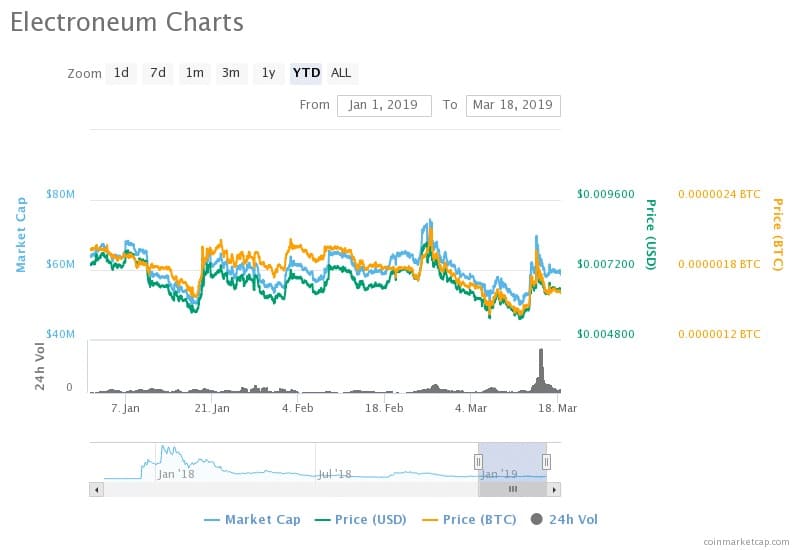
Electroneum is ranked 82nd cryptocurrency in the market, based on the analysis from CoinMarketCap. The current MCap value of ETN is USD 58,654,418 for the corresponding value of $400,961, which is influenced by the total supply of coins in circulation which amounts to 9,119,697,027. The market cap value of ETN has been majorly range bound. The MCap traded at 64 million USD at the beginning of January, the volatility of the coins had the values bouncing between highs and lows. ETN reached its all-time high of $72,613,283 on February 25, 23.80% higher than the current value, and touched its lowest value of USD 50,152,705 on March 11 which is 44.78% lower than the all-time high. The 14-day EMA exhibits an uptrend with an insignificant percentage difference. The value rose from $56,383,117 on March 04 to the current value with a 4.03% increase. This gives the bulls an upper hand.
The current price of 1 ETN is USD 0.006432 at 12:14 UTC. The price of USD has been on a homogeneous wave with the MCap value. The price of USD reached its highest and the lowest with Mcap on February 25 and March 11 with the values of $0.008074 and $0.005524 respectively. The current value is an intermediate between its high and low with the percentage difference of 25.53 and 16.44 respectively. The cryptocurrency accomplished its milestone between February 23 and 24 when the price of USD skyrocketed from $0.006839 and $0.008116. The price rose by 23.50% within 24 hours’ time period.
The present-day price of BTC is 0.00000160 at 12:14 UTC. Bitcoin’s price leads to the market in January. However, the market capsized, and the price dipped as low as 0.00000142 on March 11, 12.68% lower the current value. The price gradually increased and has reached today’s value, but the MCap/USD pair has taken the lead in the market. The highest price of Bitcoin was 0.00000210 on February 25, 31.25% higher than the recent value.
The 20-day exponential moving average displays a downtrend in the market with the values decreasing from $63,456,062 to the current value with a 7.57% fall. The volatility of the digital currency that affects the market and the differences in the percentages of the moving averages proves the bearish pressure on the market. Hence the market balance points in favor of the sellers. Investors with long term investment plans will have to sideline themselves and explore the market. The investments would work beneficial when market growth is stable. However, the trades with the short term investment plans can utilize this volatility to earn profits. Their contribution to the currency will increase its value in the future.


