Elrond Dips Below $0.010 & Draws a Bearish Divergence

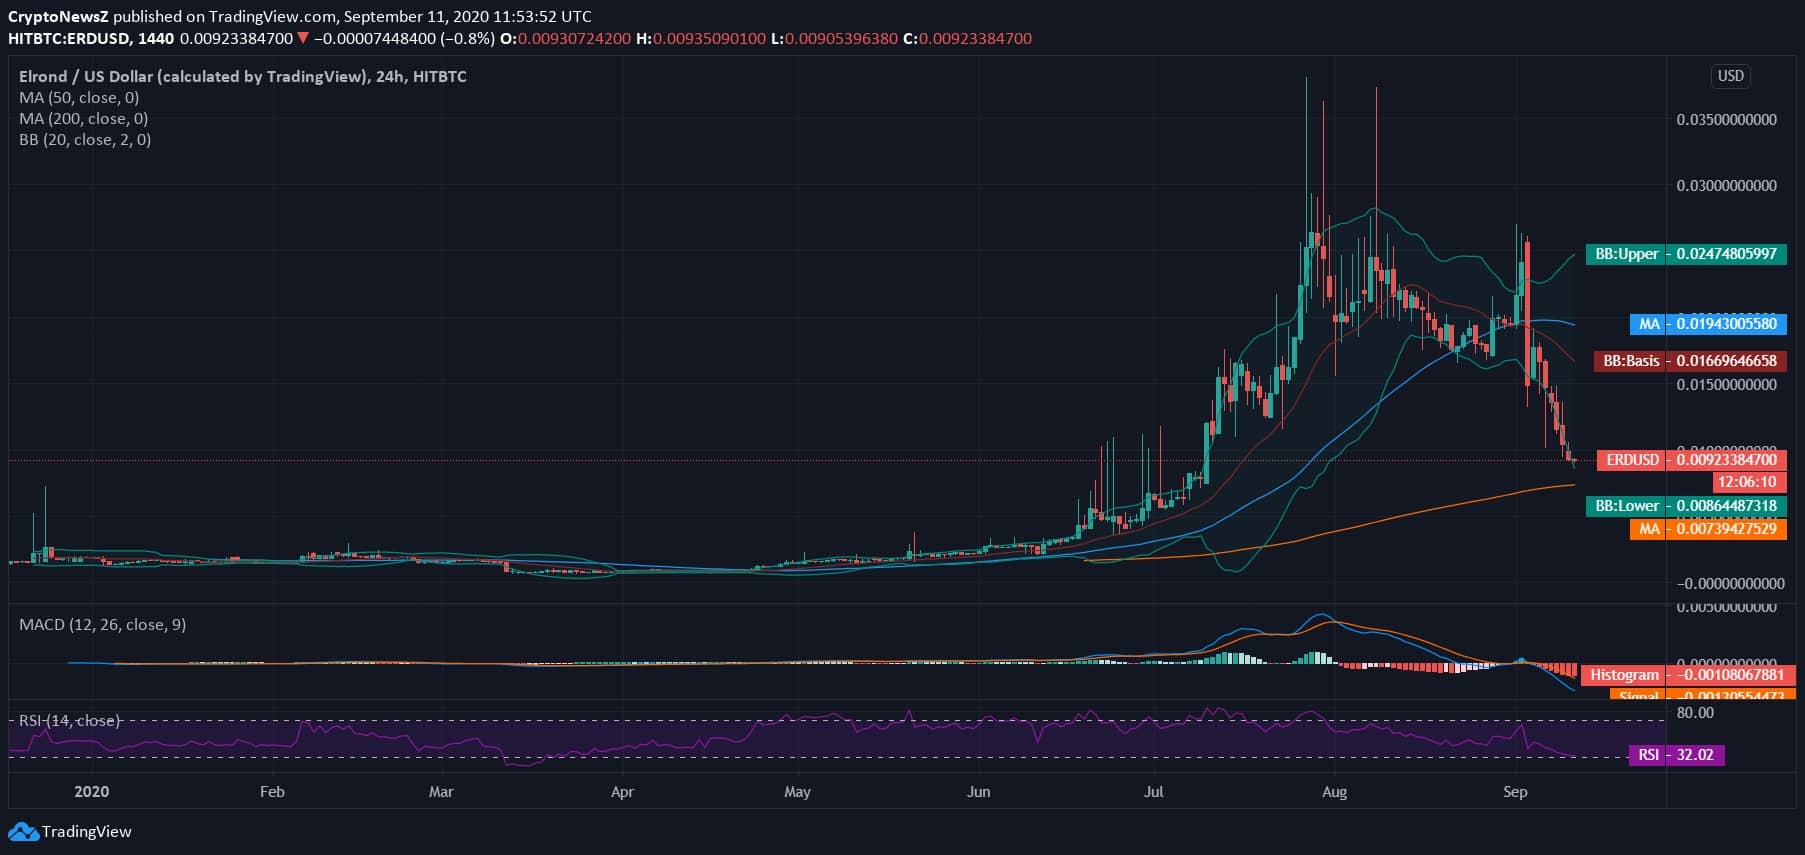
Elrond, after hitting a YTD around $0.037, it is currently trading with a complete bearish crossover at $0.0092 against the greenback. Elrond is supported by many exchanges and is made available for mass adoption as a lucrative investment amongst the top 100 cryptos of the market.
However, with the recent market condition and movement, it is currently trading with significant correction on the daily chart with over 75% dip from the high marked in the previous month.
Elrond Price Analysis

ELGD price pulls back gradually after hitting a high in the previous month. A notable correction took the price below $0.010 and is currently trading at $0.00923. However, the currency started strengthening in June 2020, after a flat movement in the first half of the ongoing year. With the negative bias in the market, Elrond is breaching the lower Bollinger Band on the 24-hour chart with a lack of support from 50-day MA after having nosedived below $0.019.
However, EGLD is still holding support from 200-day MA at $0.0073, and an even further dip will lead to test 200-day MA support too. The MACD chart reflects a negative sentiment due to no profit-making move in the near-term and expanding volatility. The RSI is at 32.02, and hence, the price of Elrond might test the major support in the upcoming hours.


