

EOS has been manifesting a decent fluctuation in the upward motion. However, a downtrend in the last few hours was quite noticeable.
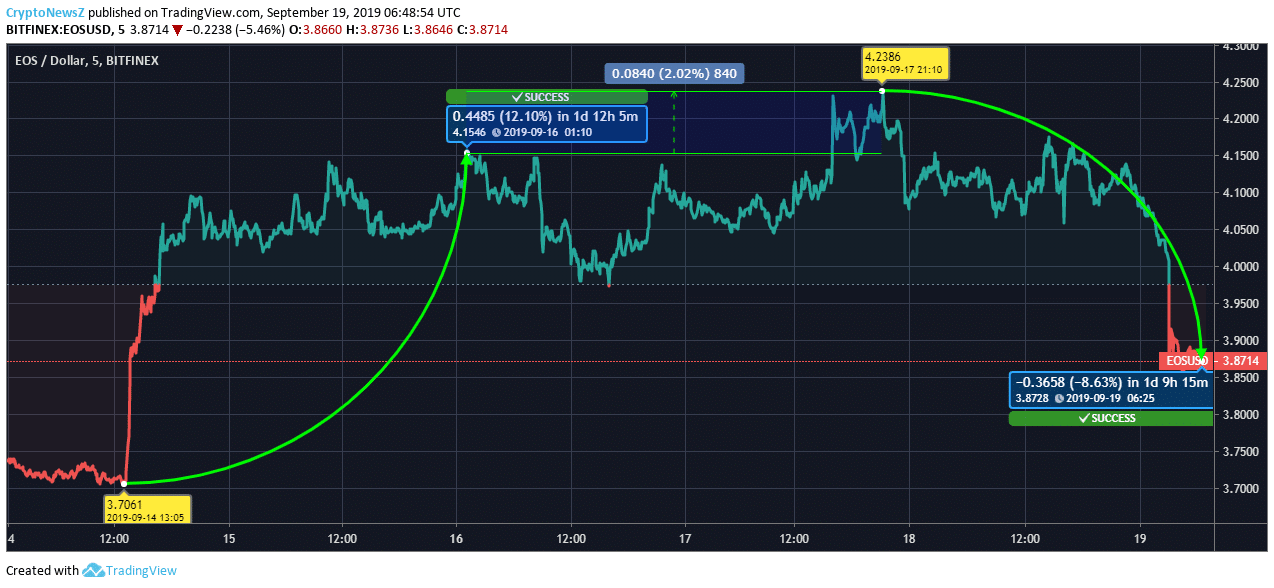
Considering the price trend from the last 5 days, EOS was initially seen at the lowest touch down on September 14, 2019, around 13:05 UTC trading at $3.7061. The value from then escalated by 12.10% as of September 16, 2019 at 01:10 UTC trading at the price of $4.1546.
After a few fluctuations, the price of EOS further increased by 2.02% as of September 17, 2019 at 21:10 UTC. EOS at that hour was trading at $4.2386. The current trading value has dropped by 8.63% from the latter price mark.
The coin was trading in the bullish zone except for the recent dip that steeply took the price to $3.87.
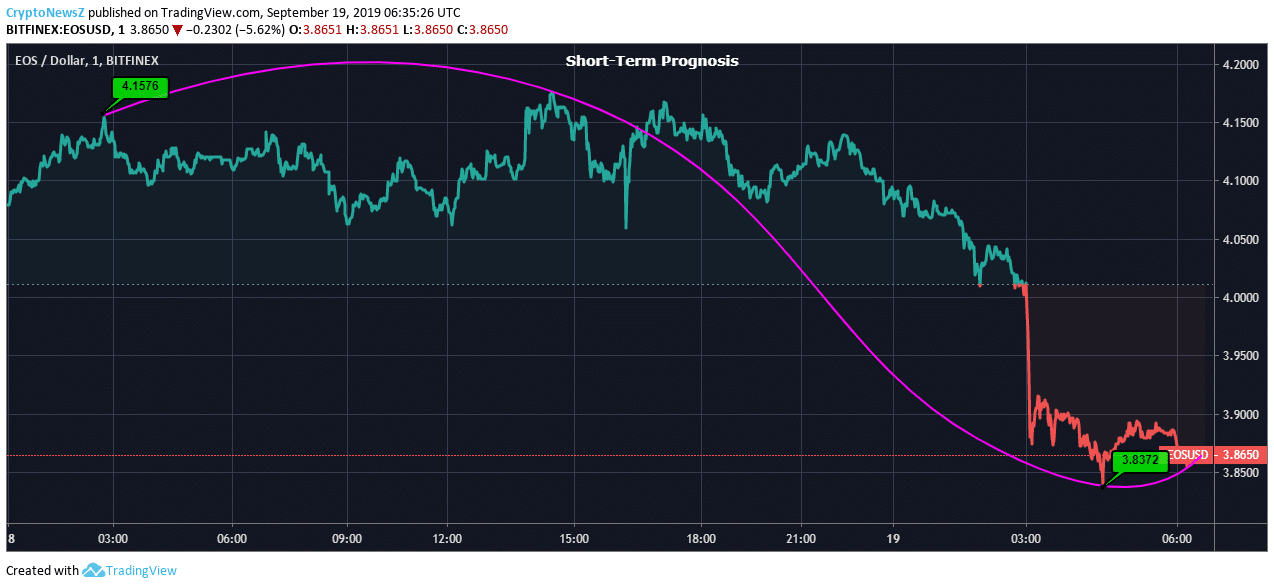
The intraday traders need to have a close look as the recent fall took the coin to trade around $3.8. The price has dropped around the lowest of the past 5 days and is also below the baseline.

If observed the long-term movement, it is showing a constant drop after 30th May. For now, long-term trade decision might settle for buying the EOS currency and wait for the fluctuations to hit the next highest point.
The resistance and support level for the better trade decision are calculated as:
Resistance Levels:
R1: $4.15, R2: $4.2, R3: $4.24
Support Levels:
S1: $4.06, S2: $4.02, S3: $3.97