Ethereum (ETH) May Have a Bullish Crossover; Hints at Reversal of the Trend

Ethereum started the trading at $150.97, in the last trading month of 2019. Currently, ETH against USD is trading at $146.93. The king of altcoins has been trading with more volatility as compared to other altcoins in the global crypto market.
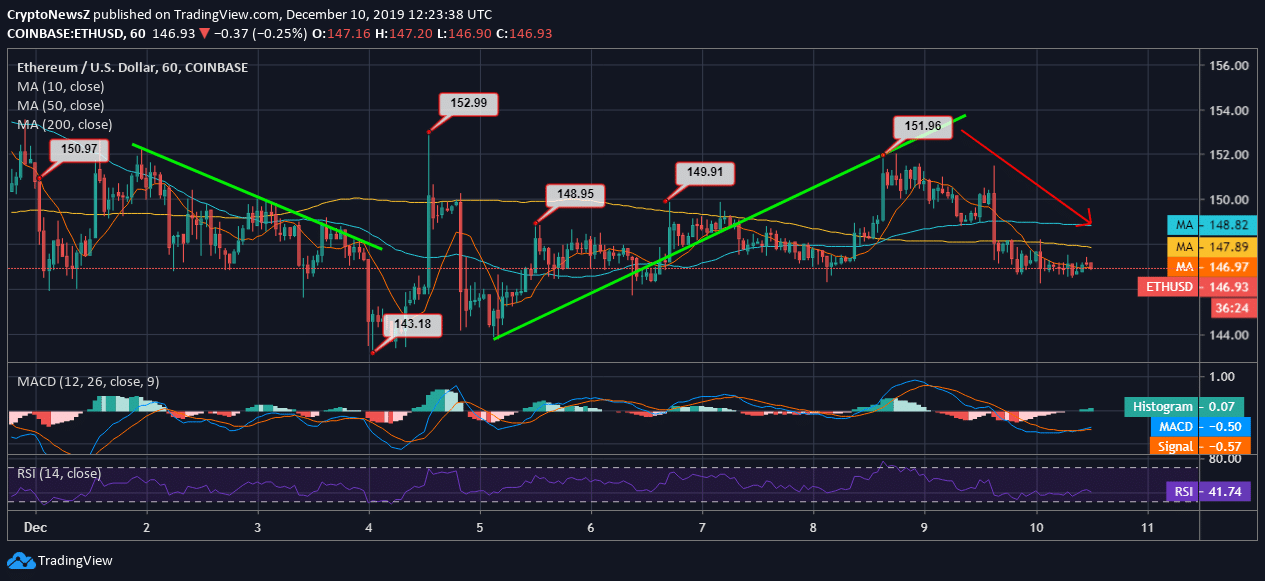
In the past two days, Ethereum has even hit the high at $151.96. However, unable to hold the coin slid down by over 3.5% and is currently at $146.93. The rising wedge was hit, which took the coin to trade around the current price area. Within the stated timeframe, ETH price has hit the high at $152.99 and a low at $143.18. The current trading price is more inclined to the lower price in the range.
ETH/USD Price Chart:

Analyzing the 10-day movement of ETH/USD on Coinbase, we rightly acknowledge the current bearish move of the ETH coin. The month also started on a declining note, but we cannot really avoid the upturn it took to trade at $152.99 after graving at $143.18—marking the 7-day low.
Later, an uptrend was formed, which gave a rising wedge until the Ethereum had the current steep fall. The major points on getting a long position in the trade were $148.95, $149.91, and $151.96 when the trend was understood to be rising. To learn more about Ethereum Predictions go through our forecast page.
Technical Indicators:
The MACD of Ethereum is running below zero, wherein the MACD line and Signal line are moving together. The MACD seems to have cut the Signal line from below, which hints at a slight bullish move, which cannot be confirmed now.
The RSI of the ETH coin is at 41.74, holds no extremities but an inclination towards the oversold region.


