Ethereum Faces More Volatility, While Litecoin Moves Subtly

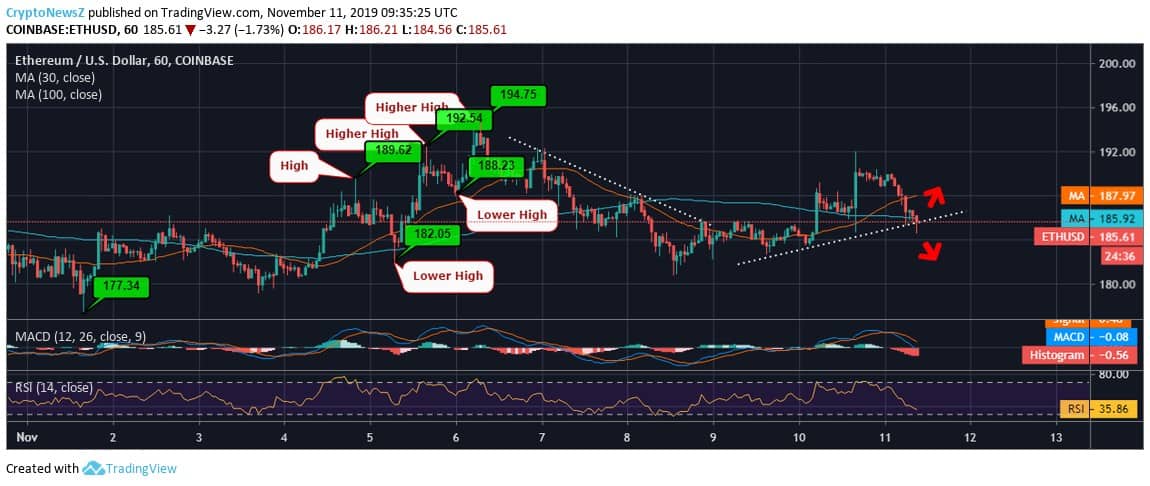
Ethereum has shown many price variations from the beginning of the ongoing month until now. It has traded in the price range of $177–$194 until the first half of the month only. With enough volatility in the market, the major altcoin has even come under selling pressure as it had no support from the short-term moving averages.
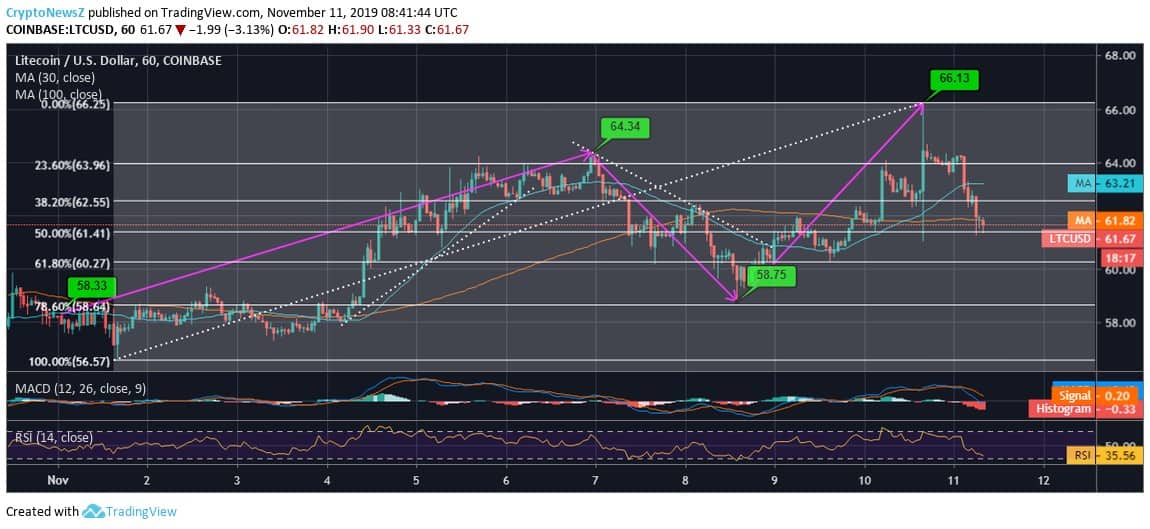
On the other hand, Litecoin also had rough patches, but the amount of volatility faced by LTC/USD has been comparatively lesser until now. LTC has been in the price range of $58–$66 in the said duration.
Ethereum vs. Litecoin Price Analysis

As observed from the above hourly chart of ETH/USD, we see that the coin was trading around $177, initially this month. Later, its spiking trend took the coin from testing supports one by one, first at $188, second at $190, and then at $192 followed by $194. Unable to cross $195, Ethereum faced supports near $180, $185, and $188. However, the latter half of the said time period has been quite dooming, and currently, it is correcting around $185 from $192 to $188 and $186. We also notice two types of trends in the latter period of the said time frame. The recent trend was previously seemed forming the uptrend; however, based on Ethereum predictions, the current price formation makes it dicey to take any investment decision in the short term.

Comparatively, Litecoin has shown lesser price variations than Ethereum in the same time frame. In the duration of the past 24 hours, LTC coin surged as high as $66.13 and currently consolidates around $61.67, which forms close support around 100-day Moving Average. The said hike in the past 24 hours at $66.13 is of over 13% when compared with the lowest at $58.33.
Technical Indicators – Ethereum
The MACD of the coin is above zero and hold a bearish outlook as the signal line crosses the MACD line.
The RSI of ETH is also inclined towards the oversold region and lies at 35.
Technical Indicators – Litecoin
The MACD of the coin is above zero and hold a bearish outlook as the signal line crosses the MACD line.
The RSI of LTC coin is also inclined towards the oversold region and lies at 35.
As per the Fib Retracement, the current price of Litecoin is slightly around 50%, which forms around $61.41.


