Ethereum Halts the Downward Correction; Hits Active Support Level

Ethereum is back in the race since when the BTC price trend is playing a crucial part behind the apparently improving crypto market. ETH has been rising since the beginning of the year, and also, the 2-day price chart shown here also manifests a visible uptrend.
Ethereum Price Analysis
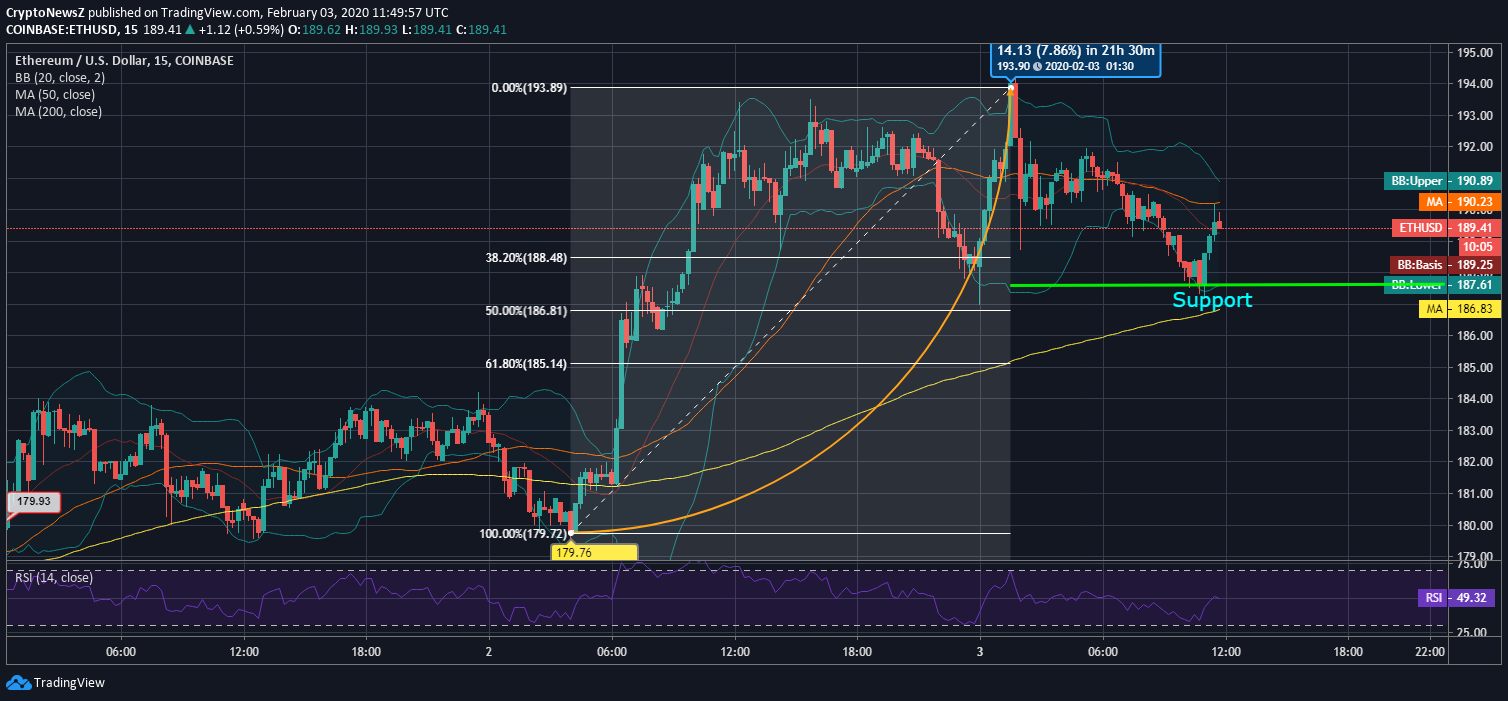
While BTC has also declined a bit over the last 24 hours, ETH has reflected a similar price trend. The altcoin has traced a close below the 38.20% Fib level today; however, the rebound move has also taken place.
Early morning price actions of Ethereum were bullish enough as it went as high as $193.90, hitting its 7-day high price mark. A couple of double tops and higher highs have been formed before ETH went this high.
Till last night, Ethereum has seen an escalation of at least more than 7%. The coin was even below $180 when it opened on February 1, and it has managed to climb above $185 over such a short period of time. It is to be noted that ETH is known to respond mildly and slowly to the market bulls.

Since today morning, The coin has constantly been dropping due to the pullback. Ethereum has managed to halt the pullback as it saw support at $187, which is a bit below the 38.20% Fib level. The rebound has just ushered the foremost altcoin above the mentioned Fib level.
Here, RSI of the ETH coin is at 49, noting a neutral phase of the coin. Confirming the same, Bollinger bands are about to have a less volatile spell. Moving averages are bullish enough at the moment as the short term SMA line is above the long term SMA line. According to Ethereum Price Prediction, now when Ethereum is already rebounding, let us see if the coin manages to hit the $190 price mark.


