Ethereum Price Breaches a 30-Month Resistance; $1000 Any Soon?

Ethereum Price: An Overview
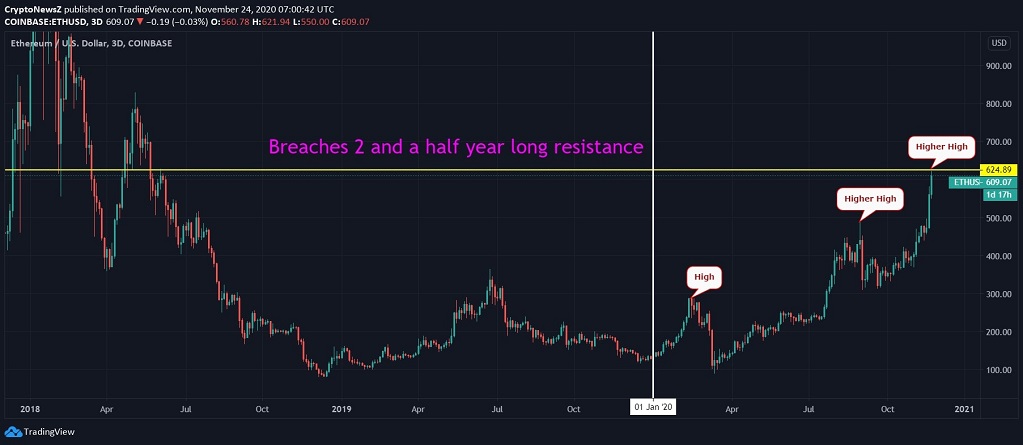
Ethereum breaks 2-and-a-half-year long resistance as it crosses above $500 & $600 with a steep bullish candlewick on the 3-day chart against the greenback. Moreover, it was until two days back when a clear uptrend was seen, but the ETH price was still below $600. Having entered the major Bull Run of Altcoins, Ethereum and XRP are seen hitting the right chords at present. Alongside, the former has regained its lost position and took over Tether. While the latter started the ongoing week with a bang and notably spurred above $600.

#ETH starting the week off strong against #Bitcoin pic.twitter.com/hTuvAAZZlG
— Benjamin Cowen (@intocryptoverse) November 23, 2020
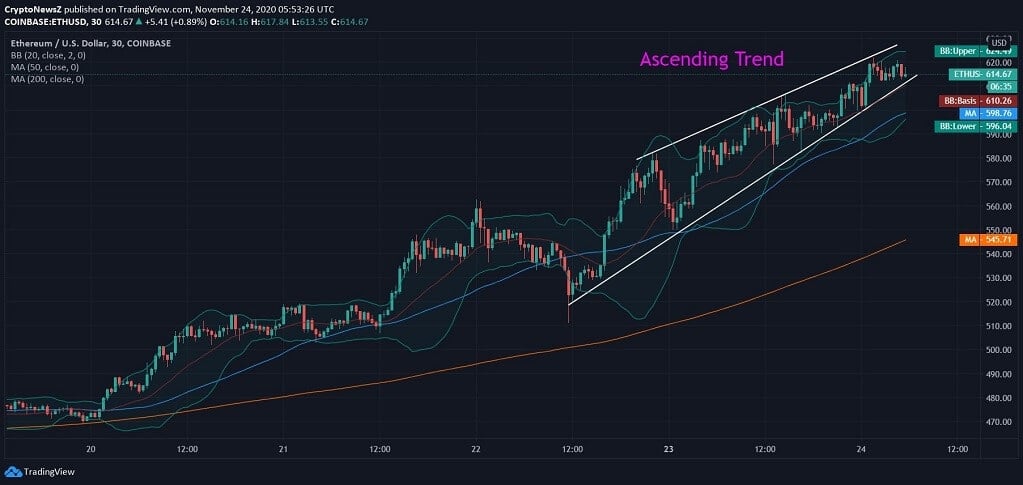
The rising wedge pattern of ETH/USD formed on the half-hourly intraday chart reflects a clear bullish signal of the leading altcoin. This ascending trend is clearly visible over the past two days when a slight bearish candlewick dropped as low as $510 to have a positive crossover later.
On the same intraday chart, Ethereum price is retaining support from half-hourly MA50 & MA200 MA at $598 & $545. Alongside, the price trend of ETH against the USD is inclined towards the upper BB, exhibiting a price rise and a bullish crossover in the intraday.
ETH 2.0: A Cherry on the Cake
While the major altcoin’s price is the talk of the cryptocurrency investor’s town, ETH 2.0 genesis is just a week away from its launch. As per the Ethereum Predictions, ETH 2.0 deposit contract has reached more than 94% of its target as the deadline for the same approaches. How glad it is to know that the community is clearly believing in the upcoming upgrade and transferring Ethereum to the ETH 2.0 account.
🥳 🍾 The Eth2 deposit contract just exceeded the required 524,288 ETH staked. Ethereum 2.0's genesis will occur in 1 week on December 1st, 2020.
We, the Ethereum community, should be proud of the countless hours that have been dedicated to making this moment possible.
— ETHGasStation (@ETHGasStation) November 24, 2020
Ethereum has always been renowned as the coin of the future, and here we are standing to see the same and the major transition into ETH 2.0. Although, Ethereum’s Proof of Stake update is way behind Cardano’s PoS but is definitely creating an edging effect in the market even before its launch.
https://twitter.com/evan_van_ness/status/1331059667905228811
Intraday Price Analysis of Ethereum (ETH)
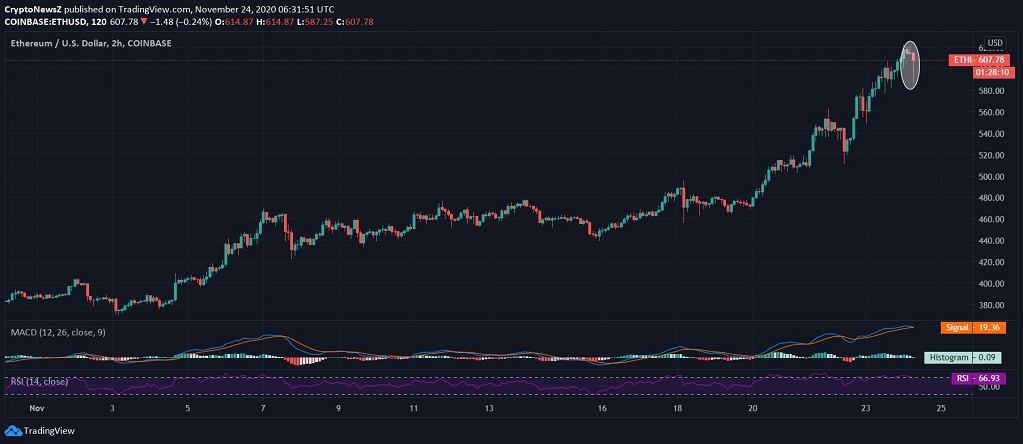
However, the price saw a drastic candlewick pullback just at the time of writing and how important it was to mention the same as the coin corrected below $610 to as low as $604 but did maintain strong support at $600.
On the 2-hourly ETH/USD price chart, a bearish candlewick is clearly visible, driving the MACD line towards the signal line for a bearish intersection but failed to experience a free fall whatsoever. With a quick change, the RSI also did not show a gliding effect and is still inclined towards the overbought zone at 66.93.
With a total positive sentiment recorded for ETH, it is surrounded by debates with the coin breaching $700 as early as by the end of this week and $1000 by the end of the year if the same momentum continues. Is it too much to look at?
https://twitter.com/cryptogeeks555/status/1330625643252502528


