Ethereum Price Corrects Downwards After Having Created a Mirage around $190

- Ethereum price hits the formerly noted resistance by trading around $185 after having corrected from $189 in the past 24 hours
- The major resistance to having a dramatic trade above $200 is $190 and $195
- ETH price forms the major support near $180, after having risen steadily from the trading price of $182
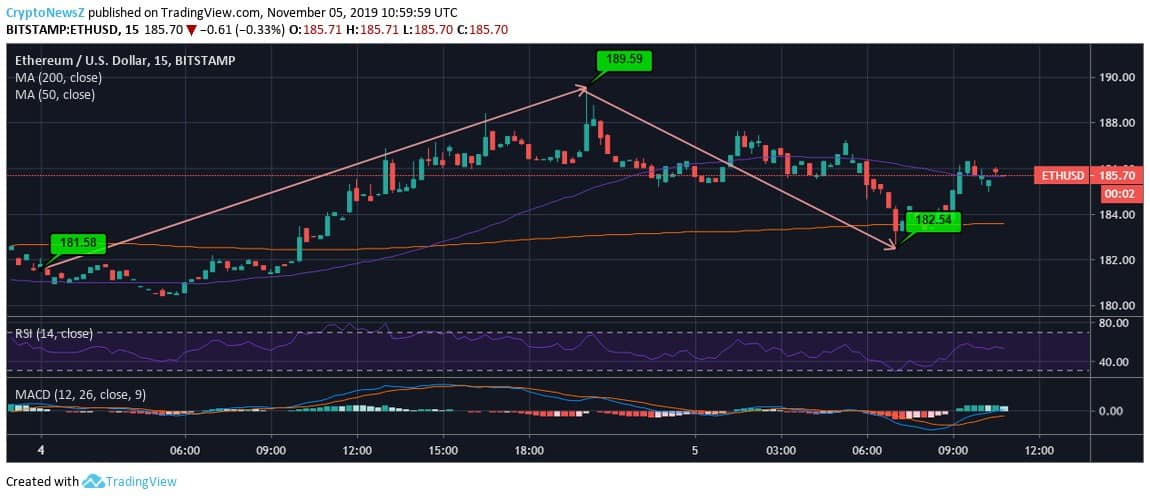
Ethereum has tested the resistance at $190 when it rose to $189.59 (data feed from Bitstamp) in the past 24 hours. Currently, Ether is in its price correction phase as it is trading around the formed resistance at $185. This was when BTC price soared above its major support and tested the major resistance at $9,500, while currently trades around $9,400.
The previously formed resistance at $185 will now turn out to be a point of support, followed by $182 and $180.
Ethereum Price Analysis:

Analyzing the 24-hour chart of Ethereum, we see that the coin has been swinging between the lowest and the highest of the said time frame. Yesterday, ETH started trading around $181.58 and had a quick pass through $182 price area to top at $189.59 by 4.41%. However, today, ETH price again slid around its major support at $182.54 and currently trades in a midrange at $185.70.
The 50-day MA, i.e. $182.83, is grounded support before the $180 price area, where the 200-day MA is notably above the current trading price.
The MACD of ETH just slid below zero when the price took a downturn to trade at $182 after mounting at $189, testing support near $190.
The RSI shows no extremities and is well above 40.


