Ethereum Replicates Bitcoin Price Trend but Inherits More Volatility Comparatively

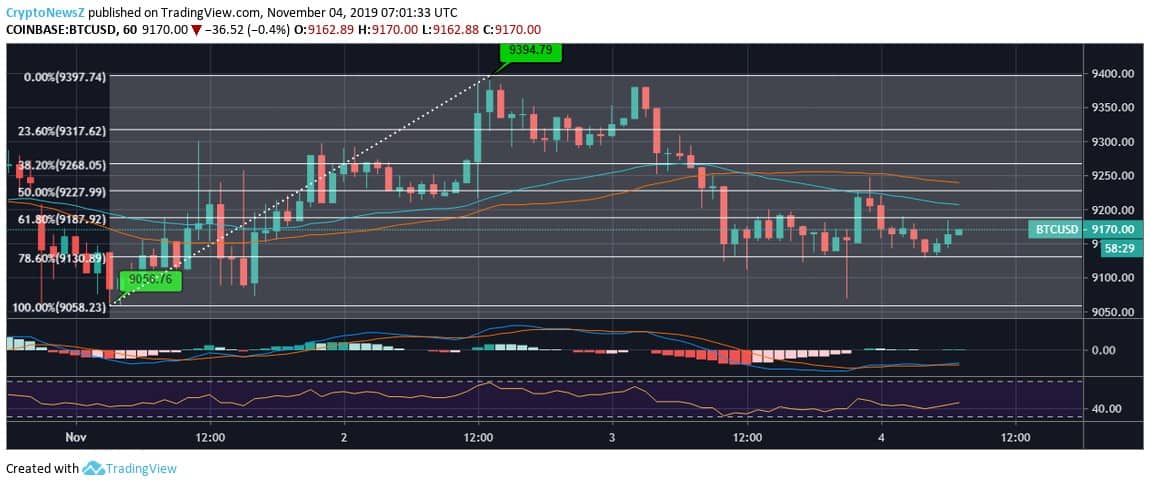
- Bitcoin continues to trade around $9,170, above its major support level at $9,000
- Ethereum also maintains the rapport and trades around $181, just above its major support at $180, after having slid as low as $177.37
- The RSI and MACD for BTC picture an almost similar move
- The price trend for ETH/USD is also a replica of BTC/USD, but with a considerate and subtle change comparatively
BTC price has been trading above $9,000 persistently since quite a notable period now. The coin traded in the range of $8,000 to $9000 on October 26, last until now. Important to note that on the same day, BTC soared above $10,000, astonishing the investors and pushing the whole crypto market.
Ethereum price, on the other hand, has been displaying quite a volatile move as it has traded in the range of $180–$190 throughout since October 25, 2019. Within the said time frame, the coin has also traced the lowest at around $161 and the highest above $190.
Ethereum vs. Bitcoin Price Analysis:

Analyzing the 3-day movement from the onset of November until the time of writing, we see that the coin has been traded as low as $177.37. On the immediate next day, ETH’s price rose by nearly 5% to trade as high as $186.27. However, currently, ETH is trading around $181.49, which is 2.56% lesser than the highest of the said time frame and 2.32% higher than the lowest, showing mid-range trading.
ETH price has its immediate support lying around $180 and the $177, as per the Fib Retracement. However, currently, the price is rightly around 50% Fib Retracement and it might cross MA50 soon. Get a complete idea about ETH coin price prediction clicking here.
Technical Indicators:
ETH is currently trading under the ‘buy’ phase, wherein the 50-day EMA ($182.69) and 50-day MA ($182.98) signal towards selling the investment as the current trading price is slightly lower than the same.
The MACD of the coin runs below zero with the MACD line and signal line crossing each other, while RSI remains slightly above 40.

Bitcoin had taken an ambiguous downturn when it traded below $8,000, marking the lowest around $7,400. However, now that it has been trading above $8,000 and $9,000, it has not marked any drastic downturn like Ethereum and is trading persistently until the time of penning down. BTC price currently trades around 61.80% Fib Retracement level. Ethereum price and its trend have turned out to be a prototype of BTC price movement and trend.
Technical Indicators:
BTC is currently under the ‘strong buy’ phase, with its 50-day EMA ($8907.87) and 50-day MA ($8705.21) being notably below its current trading price.
The MACD of the coin runs below zero with the MACD line and signal line running adjacent to each other, while RSI remains slightly above 40.


