Ethereum Resumes Price Rally; Ripple Price Trend Lags Behind

- Ethereum is taking higher strides; two sharp surges took place over the last 24 hours
- Initially, the week was heavily bearish; broke supports near $190 and $188 at the time
- Ripple looks flattish as compared to ETH; gives no signs of recovery
- ETH’s technical indicators give mixed signs, while XRP technicals remain negative
Ethereum has been continuing its bullish spree since the last Friday, considering the notable price rebound. Since yesterday, ETH coin has improved its pace while tracing a strong bullish trendline. Bitcoin has also been on the recovering phase over the last 2 days; however, both the top coins have recently traced a bearish candle.
ETH/USD Price Chart:

Over the last 5 days, Ethereum has traced a low-swing and recently has reversed the bearish impact. After dropping from its 5-day high price mark of $193, the coin has found support near $181. The coin has rapidly surged after more than a day-long consolidation. In the last couple of days, the coin has crossed above the resistance levels of $185 and $188. At 06:41:39 UTC, Ethereum is trading at $186.74.
XRP/USD Price Chart:

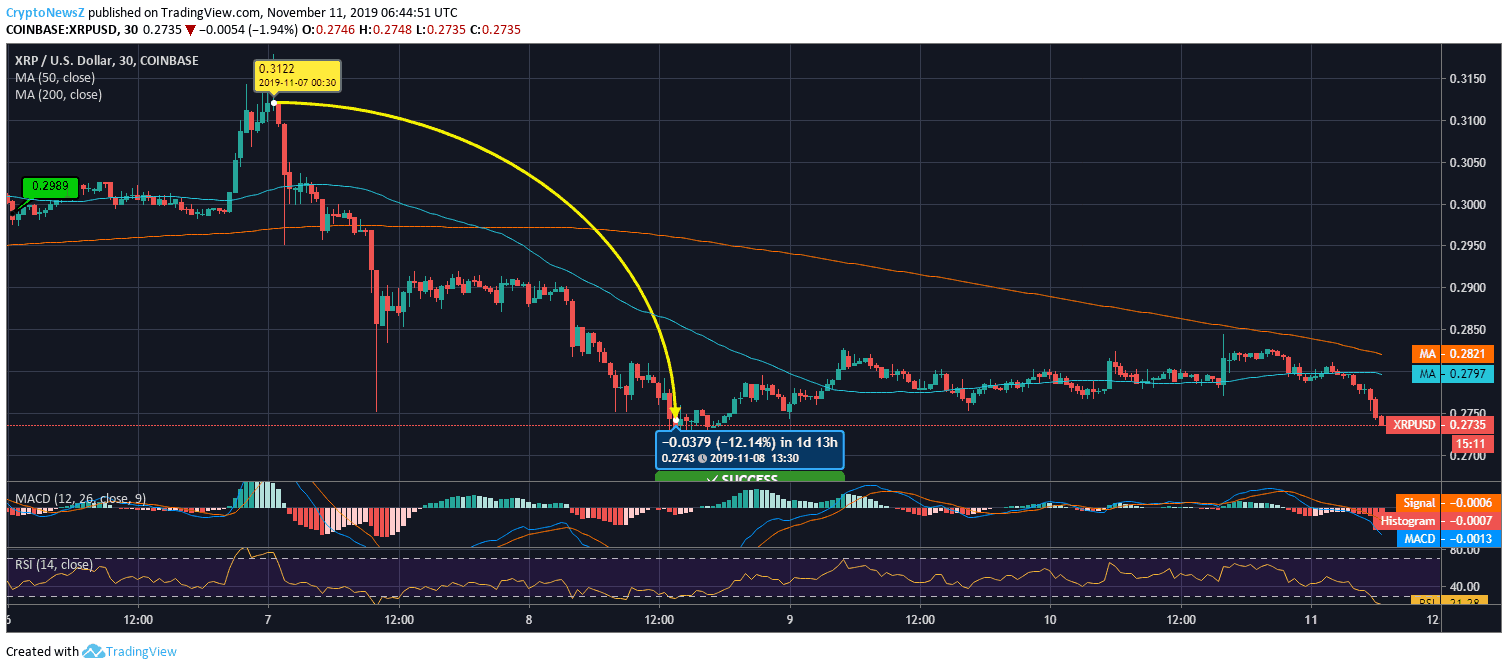
On the contrary, the Ripple price trend does not manifest any signs of surge over the last 4 days. The coin had taken a higher spike to $0.31 on November 06 and then pulled back to $0.30. The XRP price couldn’t even remain there and tumbled below major support levels with a decline of 12.14%. As the coin bottomed to $0.27, it seems to have a support level there. A mild recovery was traced by Ripple, but it has not been able to trade above $0.28 as yet.
XRP coin calls for a major price boost as its technical indicators are also pretty much bearish, considering the sluggish price trend. The short-term SMA line of Ripple is below the long-term SMA line, though with not so huge distance. The MACD indicator is in the negative zone with its MACD line below the signal line. Moreover, RSI has drifted below 30, showing the over-sold phase. XRP may see resistance at $0.2833, $0.2865, and $0.2898 and support levels at $0.2768, $0.2735, and $0.2703.
Ethereum’s technicals are less depressing than the Ripple’s. ETH’s short-term SMA line is above the long-term SMA line having a notable distance. However, MACD and RSI indicators are giving bearish signals at the moment. In the coming days, as per the ETH price prediction evaluated by experts, we can assume that the ETH coin may face resistance at $192.04, $194.59, and $198.27, and its support levels appear at $185.81, $182.13, and $179.58.


