Ethereum Tests Support at $180, Trades with Solid Selling Pressure

- Ethereum slides close to the major support around $180 and trades at $182
- ETH/USD also tests supports at $180, in the same duration once
- Ethereum faces a strong struggle to climb against its imminent supports
- Like Bitcoin, ETH price slips in the selling zone as well
After having traded below the range-bound price of $190–$195, Ethereum has been below $190 for quite a long time now. Also, just before yesterday, ETH coin remained static around $187–$189, facing $190 as the major resistance. While yesterday, it slipped below $185 and tested the major support at $185 without having grounded support from any moving average.
Ethereum Price Analysis

As analyzed from the intraday movement of the coin, we see that Ethereum is bound to a range below $190 and now nearing $180, data feed on Coinbase. Bitcoin–the king of cryptocurrencies is also struggling in the lower price range and fails to rise above $9,000, after which there can be traces of a persistent BULL Run.
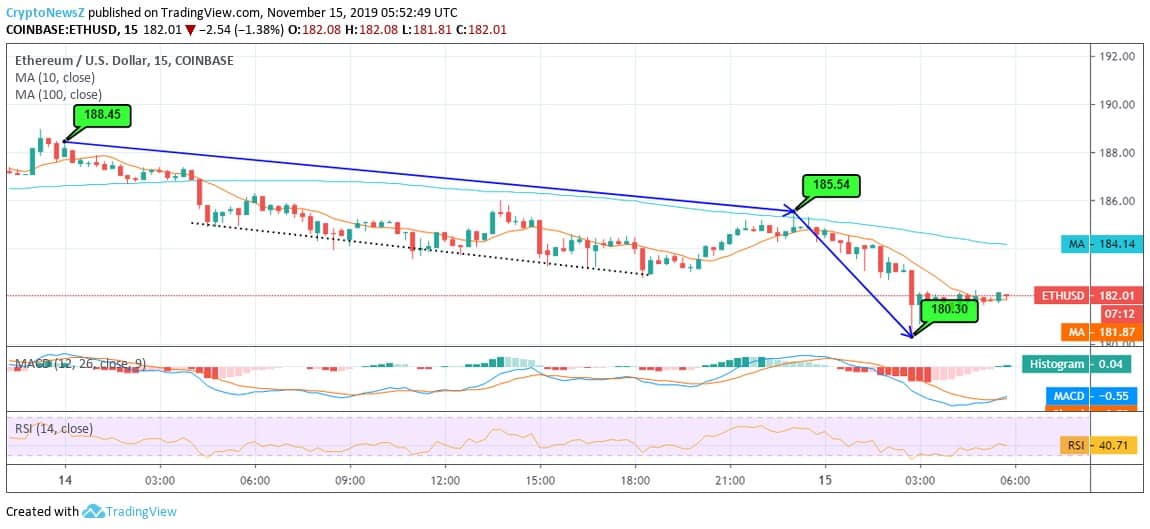
Yesterday, ETH/USD had a plunging stride trading from $188.45 to $185.54 by a mere 1.54%. Just today, in the initial trading before penning down, ETH price tested the support at $180.30 and is currently trading at $182.01 after having hit $184. Ethereum has a strong possibility of a downside break if the market fails to gear up. Know more about Ethereum predictions by exploring our technicals for the coin. With the current trading price, the coin is forming a string bearish line holding important, and key supports at $180 and $182. A breakdown was imminent when the price hit $185 support, and now if it fails to stay above $180, the investors should plan a stop loss.
Although, as per the sources, Ethereum is the king of Altcoins, and there are many investors who are holding their investments despite the bearish outlook. It is also evident as the trading volume is not directly proportion to the fall in price but is inversely proportional.
Technical Indicators:
As per the daily moving averages, the current trading price of the ETH coin is well supported by 30-day and 50-day SMA at $181 and $180, respectively.
The MACD of Ethereum is in a strong bearish zone below zero as the signal line meets the MACD line and looks like it will have a crossover soon.
The RSI of the coin is at 40 and inclined towards the lower band (oversold region).


