Ethereum Trades Below $3000; What’s Next for ETH?

Ethereum’s rise to the second-largest cryptocurrency network has been an amazing journey. From splitting to creating its market presence within a very few years to now moving on to a new validation protocol to save on electricity and other concerns put forth by analysts, ETH has the highest potential to dethrone BTC. While the facts and figures seem amazing, it even supports several blockchain networks through its layers-2 services and validations.
However, one must be wondering why it has been falling since hitting a fresh high in November 2021? The answer lies in escalating valuation based on the news of a futuristic protocol it aims to launch; ETH has been falling since, as the real date for proof of stake validation is being pushed towards the end of 2022.
From technical perception, there are strong supply and demand zones since people are most interested in buying for less since the days of FOMO have long been pushed behind. With its current market capitalization, ETH is ten times larger than Solana and close to 45% of BTC’s market value.
Ethereum Price Analysis
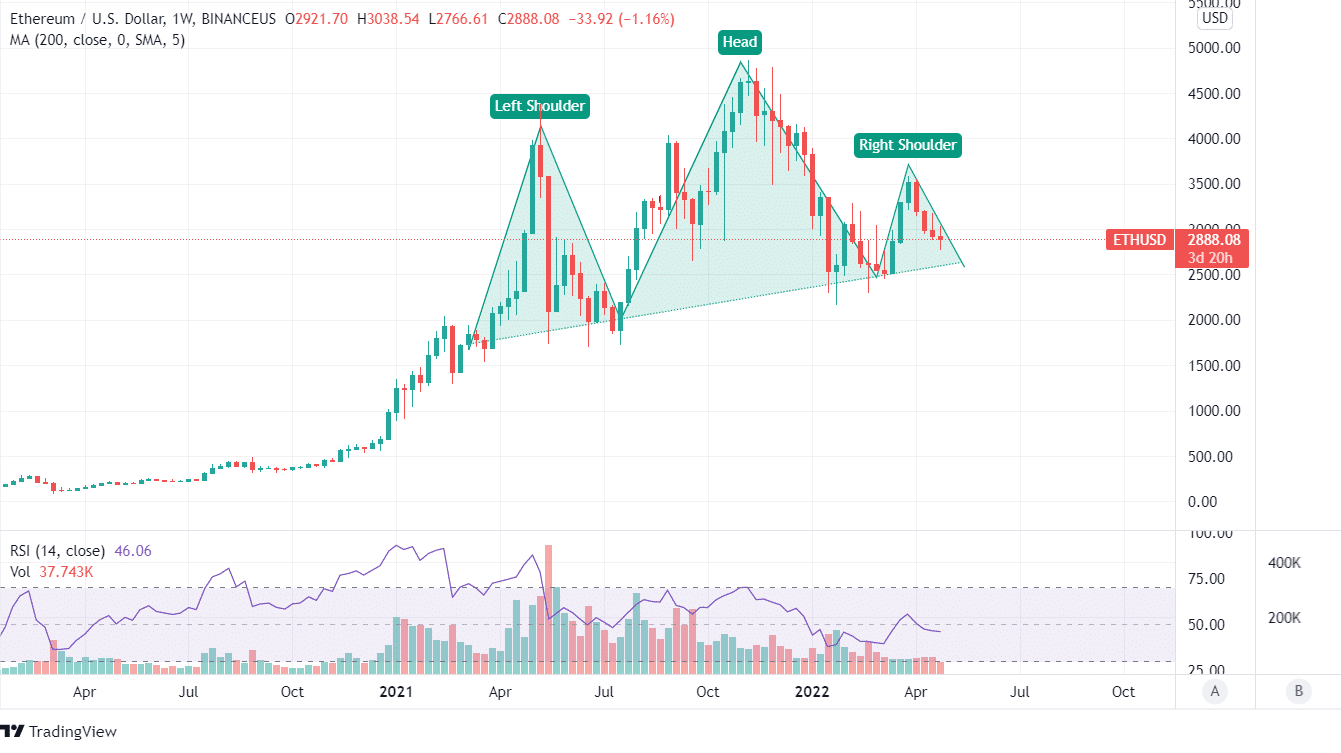
ETH price trend has time and again beaten expectations, but since ETH is trading below the 200 DMA curve, there is a negative sentiment in the short term.
At the same time, buyers are constantly attempting to breach $3600 while the 200 DMA curve is slowly dipping towards a lower level. The moment ETH surpasses this 200 DMA curve, there can be an explosive price movement towards fresh high levels.
Let us discuss the indication of technicals and price patterns of ETH in the short and long term to gain a better understanding. 
ETH has a strong demand at $2400 levels, and there can be an explosive demand from this level in the coming days. The only resistance seen above is $3200 to $3600, which has become a resistive zone hindering the further movement of ETH.
The candlestick patterns since April 2022, when ETH failed to surpass the 200 DMA resistance, have been profit booking in free fall, consolidation, and further profit booking. The recent 6% collapse on April 26, 2022, seems to be a result of external concerns about the influence of Elon Musk on the crypto market.
Since the ETH price tanked close to 22% in April, the buying strength indicated by the RSI indicator has declined by 66% during this time. Transaction volumes for the last six months have mostly remained the same, with some days of spikes but average out at similar levels. For the short term, ETH has a few milestone prices to surpass to become positively trending again. However, traders should explore market sentiments and read more about the ETH’s future price momentum before investing.
ETH price trend is strong, but weakening demand can be seen arising since the beginning of 2022. The reason for the same cannot be identified from its price trend, but one can assess that prices above $4000 will be bullish for ETH while values below $2500 will be negative.
The battle lines between the trending level of $2500 to $4000. One should ensure they don’t buy at a high value since returns on such investments would be substantially lower. Once ETH moves on to the proof of stake algorithm and improves transaction speeds, things can take a complete turnaround from current sentiments.


