Golem (GNT) Price Analysis : Golem’s Market Traversing towards Prosperity

Golem is a decentralized peer-to-peer marketplace for computing power. It turns computer power into currency. The two parties on the Golem platform are the requestor and the provider. The requestor asks for the power to perform his task, and the provider chooses amongst the task offers by considering the reputation of the broadcasting notes. After the provider chooses, the requestor checks for the reputation and sets the price with the necessary information. The reputation depends on the price results and efficient payments. After the requestor takes verification and the other measures, ethereum smart contact implements the payment.
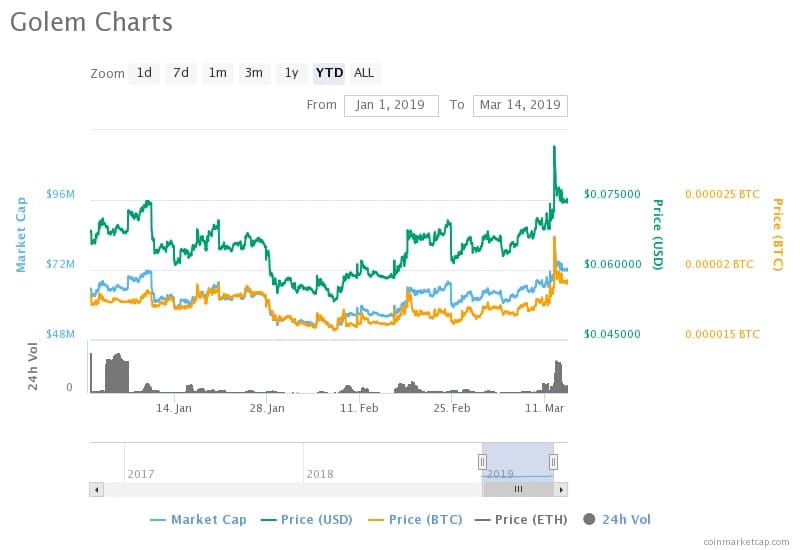
As per analysis from CoinMarketCap, GOLEM (GNT) is ranked 67th largest cryptocurrency, and its market cap value is 71,693,055 USD for the 24h Volume of USD 2,468,191 on March 14 at 12:34 UTC. This is based on the circulating supply of 963,622,000 GNT. The current market value is relatively higher compared to its corresponding value on February 14 of $56,127,396. There have been a 27.73% increase from the past. The volatility of the cryptocurrency shows oscillating values; there have been inconsequential increase and decrease in the MCap values. The 20-day EMA displays an uptrend with the values rising from $64,699,547 on February 22 to the current value with a growth rate of 10.81%. This inclination in values puts the digital currency on a bullish pressure.
Detailing on the price of USD for the digital currency, the current value of this pair is USD 0.074400 at 12:34 UTC. The analysis on the pair shows that the MCap value and the USD have been running parallel to each other from the beginning of January 2019. This cryptocurrency reached its milestone between March 08 and March 12, as GNT rallied from a low of USD 0.0.067211 to a high of USD 0.082861 which is 23.28%, a spectacular return within 04 days. Stats show that the price of USD has exceeded the price of BTC. The current value of BTC as on March 14 is 0.00001906 (12:34 UTC). Stats display the lows and highs of BTC’s price value – the low on February 07 with the value of 0.00001573 and a high on March 12 with 0.00002144. The current value is an intermediate between its high and low with a percentage difference of 21.17% and 12.49% respectively. However, the price of BTC has been on a similar tide with the MCap value; the price has been on a gradual increase recently. The price of BTC was at its lowest of 0.00001567 on February 07 which is lower by 21.63% compared to the present day value. The price of USD was at its peak on March 12 at 12:34 UTC with its value of USD 0.0.082861. Read more about Golem crypto price prediction from an expert point of view for further price speculations.
The 14-day moving average shows the values going uphill from $62,194,948 on February 28 to the current value with a 15.27 percent increase. Both the averages move in a positive direction with both the values on an uptrend and their percentages show a significant rise too. Hence the bulls rule the cryptocurrency’s market. The market is favorable to the Investors with long term investment plans. Traders also should take advantage of this levitating market to earn a significant profit from their transactions. Investment from traders will increase the value of the cryptocurrency in the future.


