Hedera Hashgraph Appears Regaining the Lost Momentum

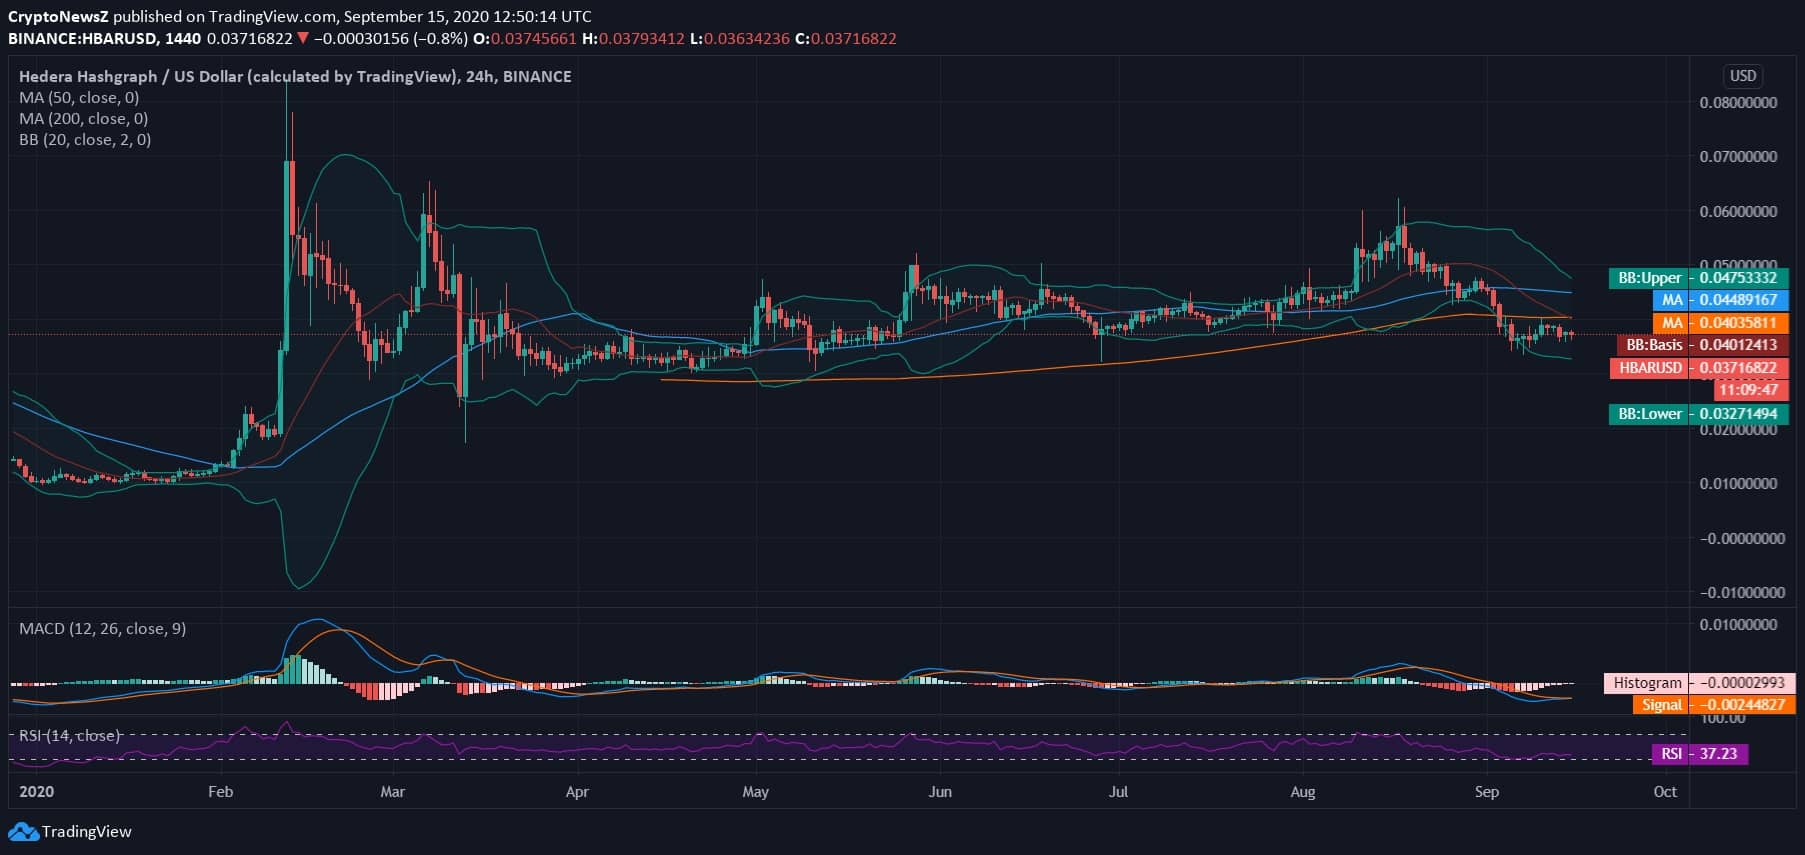
Hedera Hashgraph—one of the most lucrative enterprise solutions giving platforms, is facing a dearth of momentum against the US Dollar. After drawing a flat yet gaining trend, it breached a 5-month resistance with a bullish yet brief candlewick slightly above $0.060 at $0.061 in the previous month.
It was just then when HBAR/USD breached the upper 20-day Bollinger Band just to gradually slide and breach the lower 20-day Bollinger Band on a 24-hour chart.
Hedera Hashgraph Price Analysis

HBAR price is currently trading at $0.037 after gaining slight momentum from the Month-to-Date lowest marked at $0.033. the coin tested the recent supports after gradually pulling back from a bullish candlewick in the previous month. However, the currency crashed just when the entire market was seen testing supports along with the largest cryptocurrency—Bitcoin. Click here our HBAR price prediction by experts, which help you to guide the future price variances.
Moreover, Hedera Hashgraph, after drawing a subtle uptrend, is currently seen rising from the recent bottom. The Bollinger Bands laid do not show any trading extremity, and therefore, we do not project any volatile breakout.
With the gain in momentum in the intraday, Hedera Hashgraph’s MACD indicator shows a bearish crossover; however, the MACD line and the signal line are seen intersecting on the daily chart. The RSI of the coin is at 37.23, with a confirmed inclination towards the support area.


