ICON (ICX) Price Analysis: Will ICX Reach 1 USD In 2019 After A Rise Of 100% From Its All Time Low?

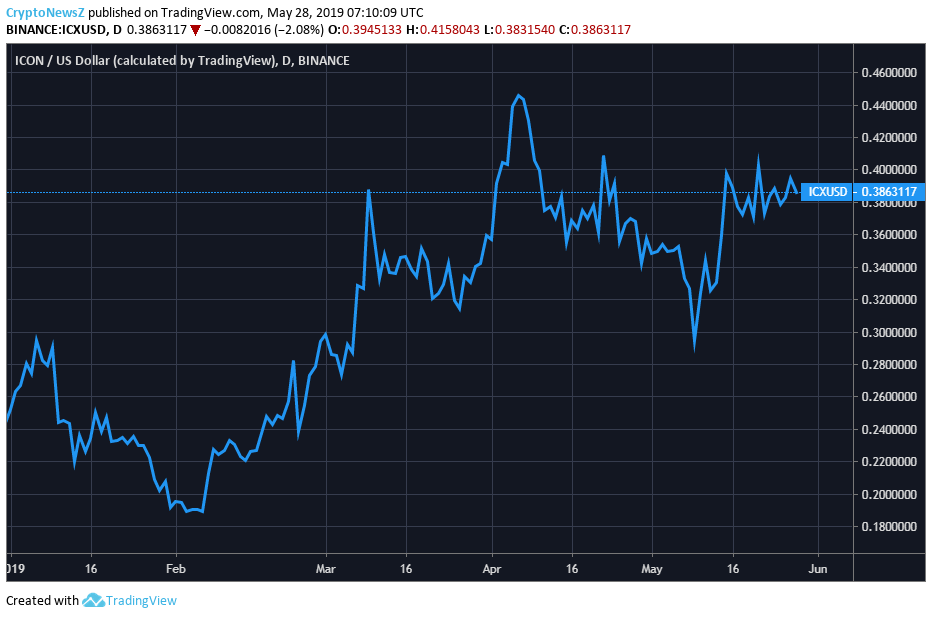
2019 continues to be the worst year for ICON. It reached its all-time low of 0.181131 from its all-time high of 12.64 USD on January 6 2018. This steep fall happened in 13 months of trading.
Will, the recent tweet by ICON of a significant crypto platform Crypto.com, having finalized to feature ICX on its pioneering wallet, a card app and the support of CoolWallet, revive ICX price in 2019?
Starting the year 2019 on a weak note, it continued its fall to touch its all-time low on February 6. From there it rose steadily to reach a three month high of 0.467946 on April 7. From there it again started falling, and even its 16th May high is 0.432699 is less than the previous high in April. It is now trading with a fall of 8.38% from the three month high. But from the all-time low in February it is currently trading at 118 % higher.
May 28, 2019, Price Statistics of ICX at 5:04 UTC:

| Ranking in crypto currency list of coinmarketcap | 48 |
| Return of Investment (ROI) | -3.22 % |
| Total Circulation | 473,406,688 ICX |
| Market Cap in USD | 187,659,463 |
| Current Price in USD | 0.396402 |
| Current Price in BTC | 0.00004522 |
| 24 hours traded volume | 18,689,760 |
| 25 days price change | 17.09 % |
May 28 Intraday price movements of ICX:
Today ICX opened at 0.389343 and inching to the 0.40 levels. There can be an upside movement for today if it cuts the 0.40 levels with volume to reach its three month high of 0.432699. Or it could be range bound between 0.38 to 0.40 levels for the day. Check out our forecast section to know more about ICX coin price prediction.
Value Comparisons & Predictions of ICX:
With its poor performance in 2019 reaching its all-time low and trading 100% above it is not a consolation for ICX. For it to reach even the 1 USD level by 2019, it has the following resistances.
- R1 – 0.429048 – 7 days high
- R2 – 0.432699 – one month high
- R3- 0.467945 – 3 months high
The support levels for it to reach back its low are as follows:
- S1 – 0.353752 – 7 day low
- S2- 0.292899 – one month low
- S3- 0.260798 – 3 month low
Conclusion:
A mini bull run in 2019 could take ICX from current levels to 1 USD with some strong fundamental support. For technical support once if it cuts the 3rd resistance level it could rally to 1 USD soon. From current price, it is nearly a 200 % return. Since the downside is limited entries near the year low could yield more returns with a stop loss of the year’s low. The risk could be less compared to the returns if investing near the third support level or the year low.


