Kyber Network (KNC) Plummets After Breaching a 2-year High

Kyber Network is a blockchain-based platform that provides liquidity, and the infrastructure is such that it supports Decentralized Finance. The network collects liquidity from various springs such as Market Makers, Token Projects, Liquidity Pools, Token Holders into a single pool, accessing the best rates for takers such as DApps, Wallets, DEXs, and End-users.
KNC token allows instant settlement, zero interaction with off-chain components, completely on-chain, transparent and verifiable transactions, liquidity integration with a self-customized business model. It was just in the previous month when the KNC token breached the 2-year long resistance as it traded above $2, after a totally flat movement in the previous year.

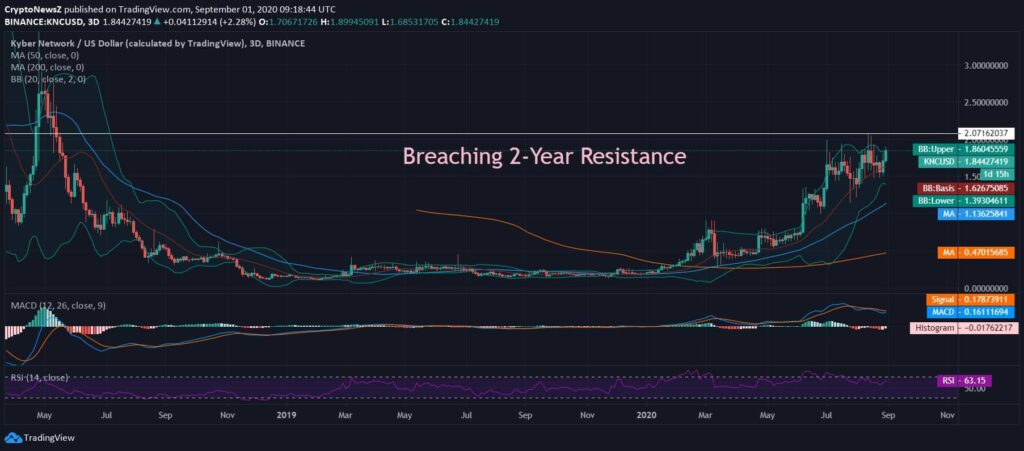
Kyber Network token, at the time of penning down this analysis, was trading at $1.844 after breaching a 2-year high slightly above $2 at $2.07. It was just in the past 15 days when the token was seen breaching the upper 20-day Bollinger Band.
However, with a gradual correction from the recent high above $2.0, it is drawing a negative crossover on the 3-day chart. The KNC token is retaining strong support from the MA50 and MA200 at $1.13 & $0.47.
But if the token draws downward correction even further, it is likely to breach the lower Bollinger Band, followed by MA50. The MACD chart of the Kyber Network token draws a bearish divergence, and the RSI is lying at 63.15, showing an inclination towards the overbought region as KNC trades well above $1.5. You can read more about Kyber Network & its future value here on our forecast page, go and check out to learn more about it.


