Litecoin (LTC) Price Volatility May Lead to Intraday Loss

Litecoin was trading with a slightly bullish trend, which now seems to plunge. This volatility in the market is indicating a negative closing when compared to yesterday and the entire week has been quite fluctuating. However, there was been a moderate increase in price. On October 9, 2019, the price was at $56.09, with a market cap of 3,552,792,224 USD. Today, the price has reached $58.46, and the market cap is at $3,708,669,887. The moderate uptrend is expected to catch up the speed.
The price was seen touching a high at $59.93, and the lowest was marked at $56.98. Let’s have a look at the intraday chart.
Litecoin Price Analysis:
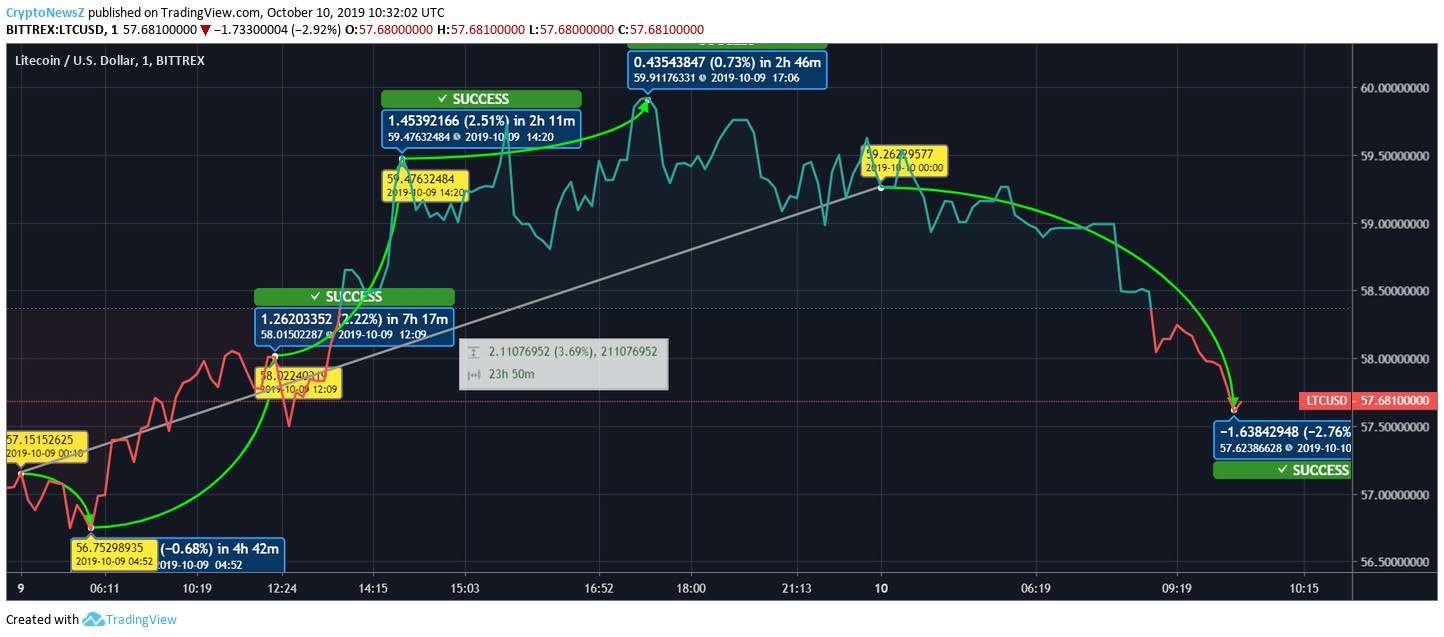
The chart is data feed from Bittrex as on October 10, 2019, at 10:32:02 UTC for price.

The graph is reflecting a reverse curve. Yesterday, Litecoin started the day with a slight drop of 0.68% as the counters slipped from $57 to $56. Later the upsurge began as the price first jumped to $58 by 2.22%, then $59 by 2.51% and finally $59 by 0.73%. The day closed around $59, marking an intraday gain of 3.69%. Today, the currency is slipping since the start of the trading duration. The fall is moderate, but yet has touched $57 by 2.76%.
Litecoin is anticipated to have a great future. In the first two quarters, Litecoin outperformed Bitcoin, which gave us a clear indication that LTC holds great potential. The coin is the 6th largest coin in the global crypto market.
Litecoin would be giving the best result to the long-term traders as per our LTC Predictions. The short-term could also help the traders to earn benefits, but the long-term is likely to be more voluptuous.


