Litecoin Plunges Yet Remains Strong; Bitcoin Seems to Move Impromptu

Litecoin takes a relaxing stride and, moreover, remains strong in this strong volatility while Bitcoin moves unrehearsed throughout. Litecoin doesn’t show enough price variation in comparison to Bitcoin since the start of a trading hour on November 12, 2019, until the time of writing.
As per the technical indicators, BTC/USD trades in the strong selling zone, and on the contrary, LTC/USD trades in the ‘buy phase.’
Litecoin vs. Bitcoin Price Analysis

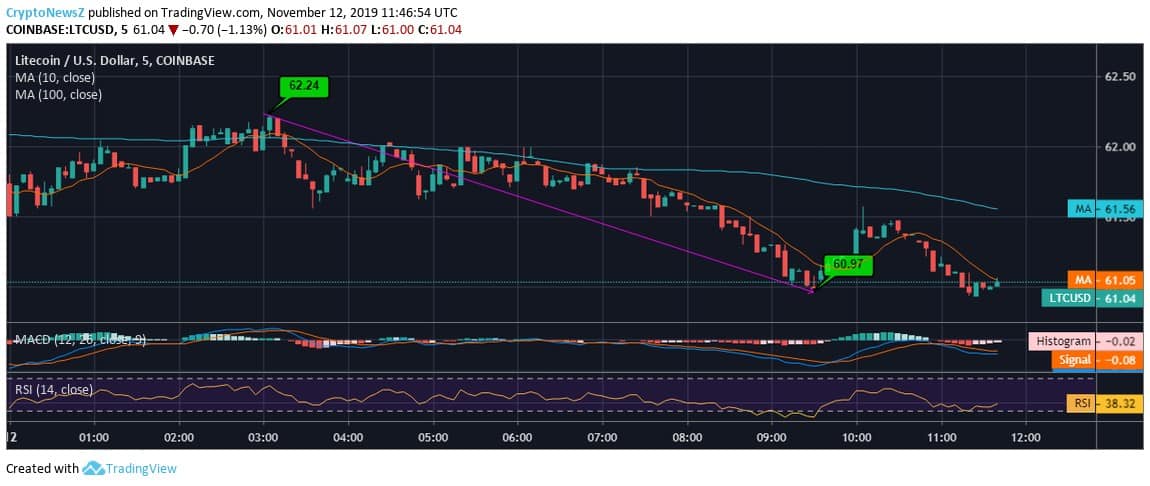
As per the intraday movement of Litecoin price, we see that the trend is quite relaxing. Initially, around the trading daybreak, LTC was mounting at $62.24, with the support of short-term moving averages. However, as the day continued, LTC candle formation turned red and started declining when it lost over 2% to trade at $60.97; however, at the time of writing, it was trading at $61.04, which was a mere rise of 0.11%.

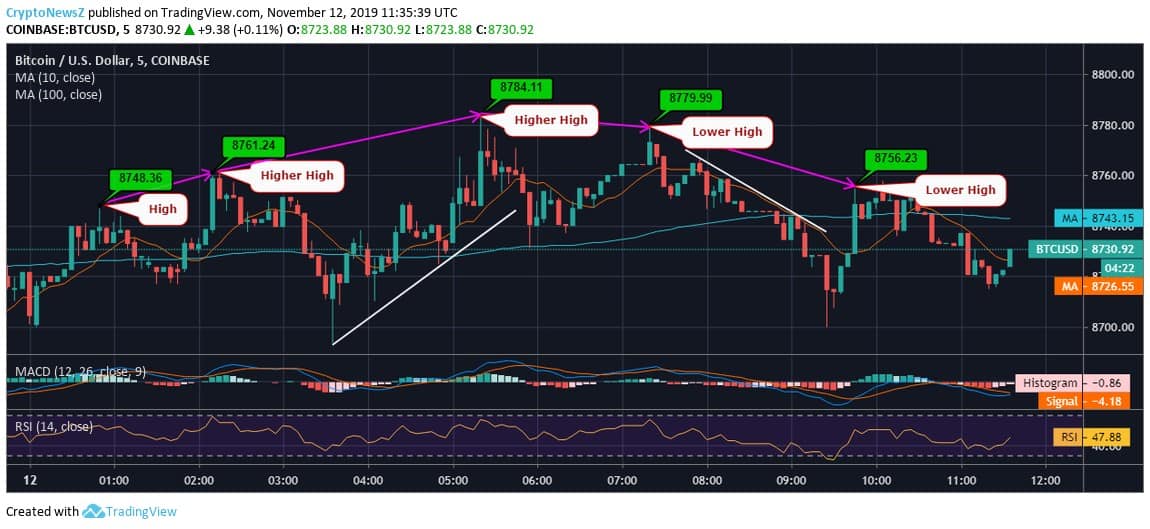
On the contrary, Bitcoin is trading with more volatility when compared to Litecoin. Litecoin has always been the result-giving coin, and we believe that it can stand along with Bitcoin and is one of the altcoins that have the highest potential. As per the above chart movement, we believe that the coin has exhibited the downtrend as well as the uptrend from ranging around $8,748.36 to rising at $8,784.11 and then falling at $8,756.23 showing all the price variations within 2% change.
BTC has no grounded support from the short-term moving averages at present, and we believe that LTC is comparatively stronger as manifested from its price trend until now. And, also go through Litecoin Forecast data, to know what will happen in upcoming years with the price of LTC.
Technical Indicators- Litecoin
The MACD of the coin runs bearish and below zero as the signal line crosses over the MACD line.
The RSI of Litecoin is at 38 and inclined towards the mild oversold region.
Technical Indicators- Bitcoin
The MACD of the coin runs bearish and below zero as the signal line crosses over the MACD line.
The RSI of Bitcoin is at 37 and shows no extremities at present.


