Litecoin Price Slides to $59; Runs Bearishly Around 7-day Low Price

- Litecoin (LTC) trades below the major support level at $60
- As per anticipation, a downside break below $60 would invite a major plunge in the upcoming days
- The Market of LTC has also seen a decline after it slid downsides
Just when we thought that Litecoin was performing comparatively stronger in the global crypto market, it recorded a plunge below $60 in the early trading hours today. It was also anticipated that if LTC/USD slid below $60 – the major support area, it would lure a major sink then. From trading in the ‘strong buy’ phase, LTC coin has now shifted to the ‘strong selling’ zone. Also, Litecoin has no support from the daily short-term moving averages, while it seemed to have lost the ground absolutely, as per the daily moving averages.
Litecoin Price Analysis

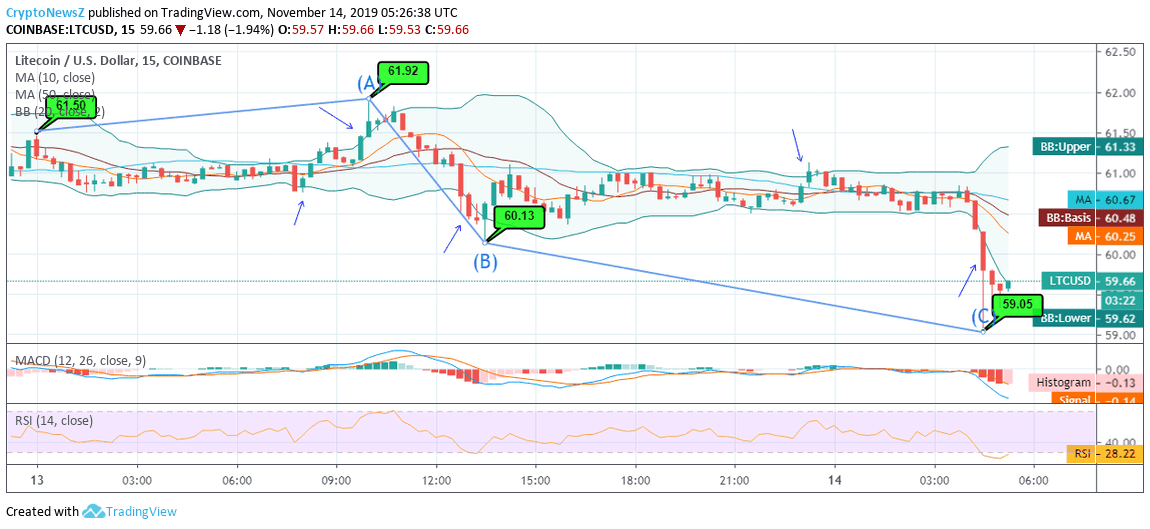
Analyzing the intraday movement of LTC/USD on the exchange of Coinbase, we see that the coin has slid below $60 and is near to its 7-day low. The downward stride of LTC has been quite subtle and marginally volatile. Within the said time duration, Litecoin has been traded in the price range of $59.05 to $61.92, exhibiting an equal number of red and green candle formation.
Yesterday, Litecoin was initially traded at $61.50, when the narrowing of Bollinger Bands took place, and the price broke the upper band to the range at $61.92. However, as the bands widened, the candles in the price trend took an inverse turn and broke the lower Bollinger Band to trade at the major support price, i.e. $60.13. Later, the major catalyst of the LTC price trend led to a break open after moving moderately, and the red candles broke the lower band to trade at the lowest, i.e. $59.05.
All the downside breaks have led the Litecoin to trade and test the major supports. Now there has been an S/R flip which says that the major supports than have turned into major resistances like $60, $61 and beyond. If the LTC price takes a permanent downside below $60, it will turn out to be the loss-making investment in the short-term.
Technical Indicators
The MACD of LTC/USD, as observed from the intraday movement, has slid below zero after being inclined to it for a long time. However, it possesses a bullish crossover as the MACD line overpowers the signal line with a chance to grow above as it is not yet below its 7-day low. Read more about LTC Price Prediction from an expert point of view for further price speculations.
The RSI of the Litecoin is inclined to the oversold region at 28, as it is in the strong selling zone.


