LTC And BCH Prices Honk The Horns; BNB Rides The Bull

Litecoin (LTC/USD) Price Analysis:

Litecoin was dealing with profits on yesterday’s price chart. The coin is at 5th rank in the crypto market. The market cap noted on 12th August 2019 was $5,477,250,373. LTC coin has a high prospect of an upsurge in the future. Let’s have a look at the Litecoin price chart.
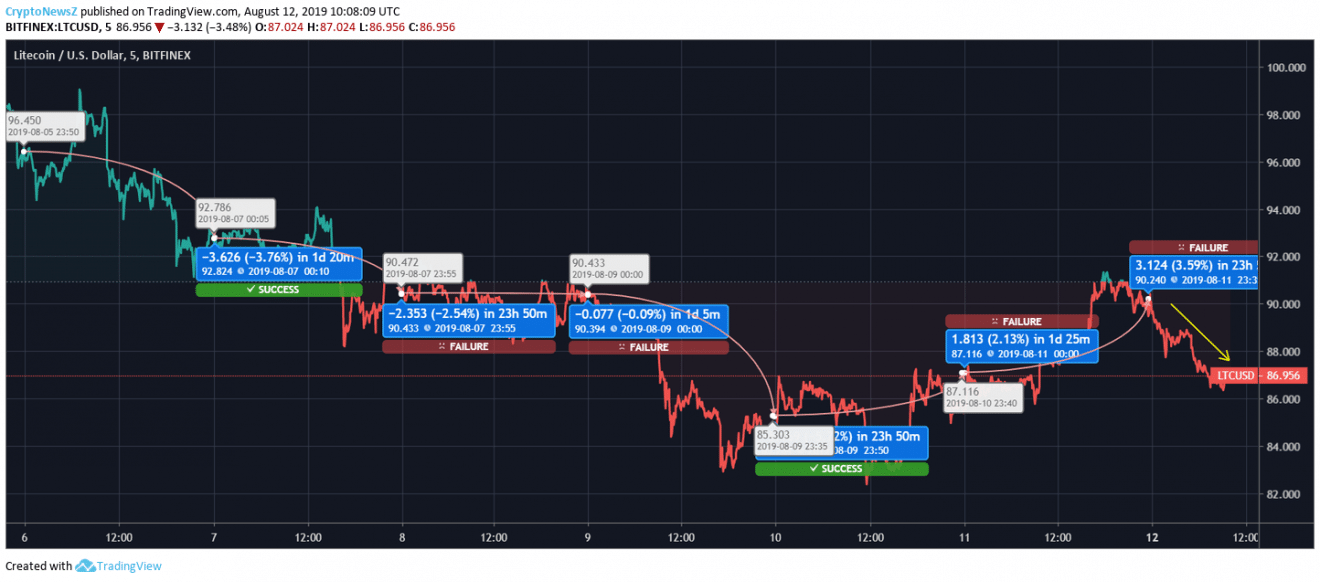
The Litecoin started the week at $96.450. The coin registered a fall on 6th August of 3.76% and closed at $92.78. The fall continued on 7th August too. Litecoin slipped from $92.82 to $90.43 by 2.54%. The coin reflected a moderate price movement on 8th August. LTC price moved from $90.43 to $90.39. On 9th August, Litecoin price fell from $90.39 to $85.30 by 4.12%. The escalation started on 10th August. The currency jumped from $85.303 to $87.11. The progression was of 2.13%. Yesterday, the coin jumped from $87.116 to $90.240 by 3.59%. Litecoin is best suited for long-term traders. The coin would be seen dealing at an astounding level in some time.
Bitcoin Cash (BCH/USD) Price Analysis:

Bitcoin Cash is dealing around $5,945,687,641 Market Cap at 11:36 UTC. The given BCH price chart describes the week-long movement of the coin. Bitcoin Cash has almost recovered the drop from the last two days. On 6th August, the BCH coin price slipped from $344.71 to $334.33 by 2.98%. On 7th August, the coin shifted from $334.33 to $337.60 by 0.94%. On 8th August, the coin registered regression of 2.04%. The coin slipped from $337.60 to $330.72. On 9th August, the coin continued the regression. Bitcoin Cash fell from $330.72 to $324.080 by 1.94%. On 10th Aug, the coin moved from $324.080 to $323.49 by 0.22%. Yesterday, the coin recovered from $323.49 to $337.018 by 4.10%. Today, the coin opened at $337. The coin fell to $329 and is currently dealing at the same. The fall of the coin would soon be recovered. The upsurge in the coin would take it some great level. The long-term investment in the coin would bring high returns.
Binance Coin (BNB/USD) Price Chart:

Binance Coin is dealing with the bulls. The said uptrend started a few days back and is still on the run. The investment in the BNB coin would give a flourishing result. To have a precise look, let’s go through the weekly chart of Binance coin.
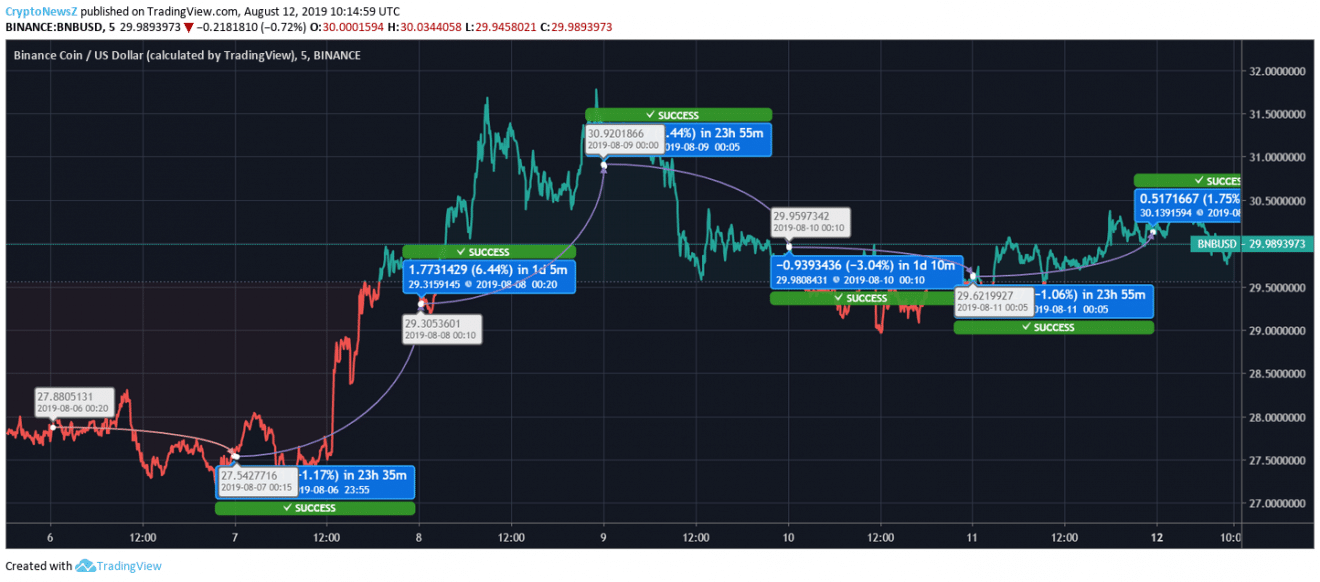
Binance Coin price chart is reflecting an upsurge in price. The coin opened at $27.88. The coin booked a regression of 1.17%. BNB coin closed the day at $27.54. On 7th August, the coin started the escalation. The coin jumped from $27.54 to $29.31 by 6.44%. On 8th August, the Binance coin moved from $29.31 to $30.92. The progression was of 4.44%. BNB coin booked a regression on 9th August. The fall was of 3.04%. The price changed from $30.92 to $29.95. On 10th August, the coin continued the regression. The coin switched from $29.95 to $29.62 by 1.06%. On 11th August, Binance coin price started climbing again. The progression marked was of 1.75%. BNB price changed from $29.62 to $30.13. Today, the coin opened at $30.13. The coin is currently dealing at $29.989. We would recommend the traders to dig in for the short-term plan.


