Monero Price Analysis: XMR Traces a Lower-High Over a Month

Last one month has been like a roller-coaster ride for Monero coin as it has covered a vast span of price range while tracing two major high price spikes. XMR at present is going through a bit gloomy phase as its price is dropping since today morning.
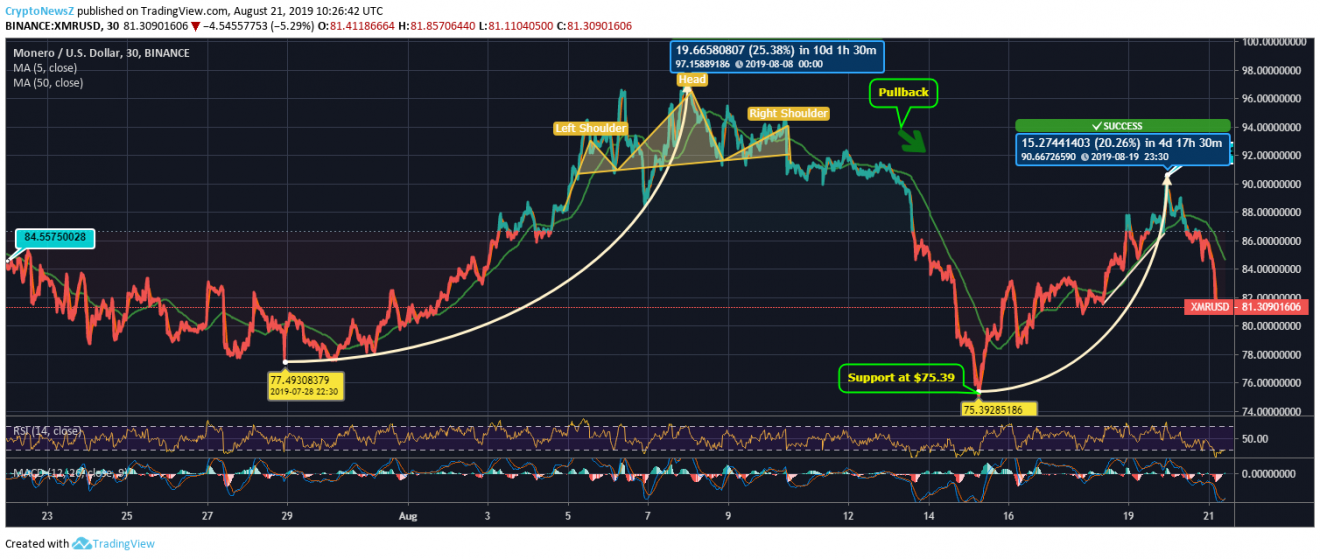
Monero was trading with its price at $84.55 which later had a low swing at $77.49 before initiating a price surge. Monero had found a strong support level there and it took a steady yet gradual surge which took the coin as high as $97.15 on 8th August. Here, the coin has traced a head and shoulder pattern indicating an upcoming price drop.
As the coin could not fight resistance beyond $97.15, it corrected down near $91. After that, XMR saw a heavy fall to $75.39 which is where it found another support. The coin rebounded from there and it managed to reach $90.66 with an increase of 20.26%. XMR is correcting down from there, and is at $81.30 at 10:26:42 UTC.
XMR/USD Price Chart

Monero’s current price is below its 50-day SMA along with its 5-day SMA. Also, its long term SMA is above its short term SMA indicating bearish price momentum. According to Monero future, XMR is trading under selling pressure.
Monero Price Prediction & Technical Indicators:
MACD chart of XMR/USD is volatile enough and is in the bearish zone. RSI for the coin is at 30, which shows that the coin is nearing the oversold phase. The coin may face resistance at $89.63 and support at $80.66.


