Neo (NEO) Falls due to the Market Pressure; Ethereum Classic (ETC) and Cardano (ADA) walk up on the Weekly Chart

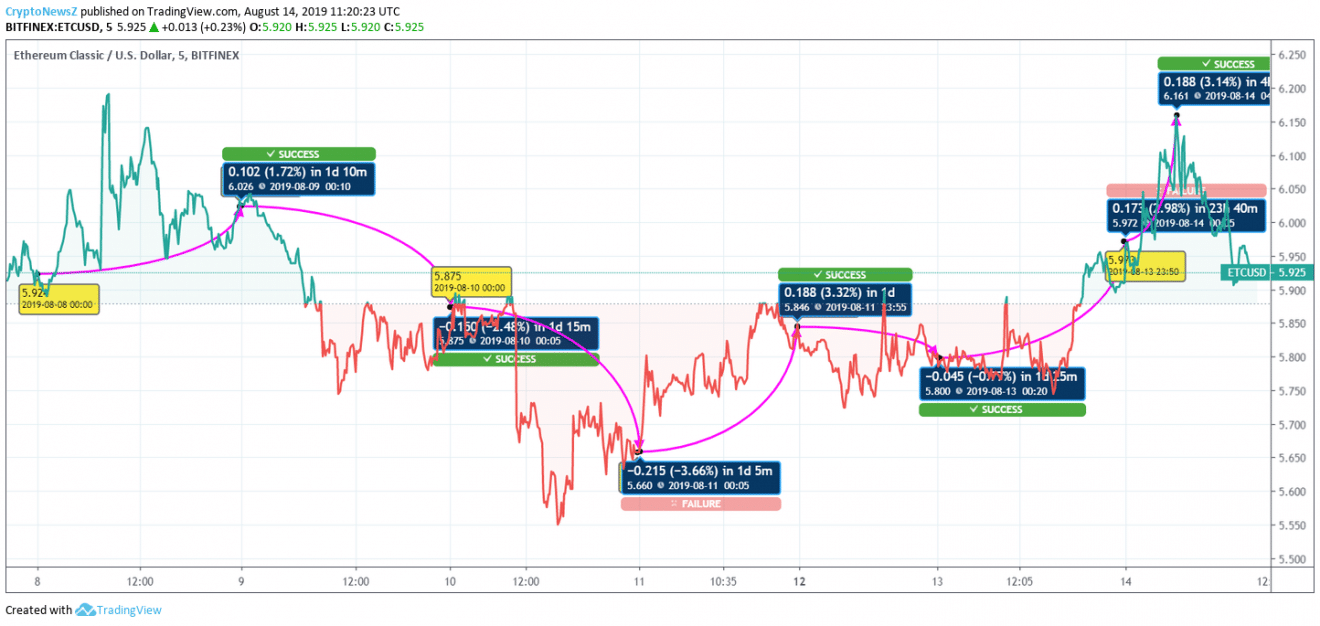
ETC to USD Price Chart:

Ethereum Classic (ETC) is reflecting an extraordinary potential lately. The coin is contradicting from the current market trend and climbing up. The coin opened today with an upsurge and is presently trading at $5.9. The market cap is noted as $663,712,322.
Ethereum Classic (ETC) week-long chart is reflecting an upsurge in price. The coin started at $5.9 on 8th August. The coin switched from $5.9 to $6 by 1.72%. On 9th August, the coin slipped from $6 to $5.8 by 2.48%. On 10th August, the downtrend continued and the price switched from $5.8 to $5.6 by 3.66%. On 11th August, the coin registered a progression of 3.32%. The coin jumped from $5.6 to $5.8. On 12th August, the coin again fell from $5.84 to $5.80 by 0.70%. Yesterday, the coin climbed from $5.8 to $5.9 by 2.98%. Today, the coin again escalated from $5.9 to $6.1 by 3.14%.
The coin is recommended for the long-term investors. The said period would bring colossal profit to the traders.
ADA to USD Price Chart:

Cardano (ADA) is walking on its usual path. The coin is known for its volatility in the market. A few days back, the coin was at 13th position and now it is at 12th position, replacing Tron (TRX) in the market (as per coinmarketcap). To understand the momentum of the coin, let’s have a look at the weekly chart.
The coin is reflecting a slight uptrend in the coin. On 8th August, the coin slipped from $0.0517 to $0.0515 by 0.53%. On 9th August, the currency slipped from $0.051 to $0.047 by 7.49%. On 10th August, the coin climbed from $0.047 to $0.052 by 10.97%. On 11th August, the coin again jumped from $0.052 to $0.055 by 1.15%. On 12th August, the coin slipped from $0.055 to $0.052 by 4.48%. Yesterday, the coin slipped from $0.0526 to $0.0521 by 0.82%. The coin booked a progression today. The price switched from $0.052 to $0.053 by 2.78%.
The pick and fall in Cardano (ADA) acts as an adventure for the traders. The coin has a bright future ahead. However, we would recommend diverging the investment to cut short the risk.
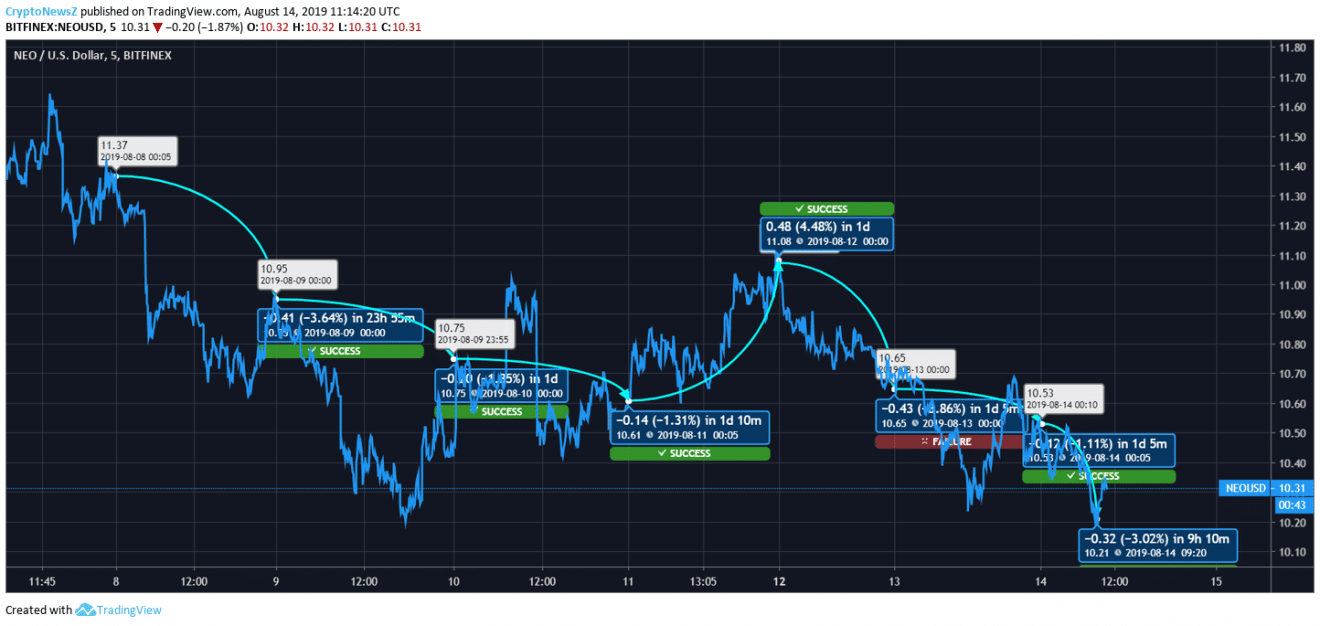
NEO to USD Price Chart:

NEO is currently trading at $10.31. The coin is under deep market pressure and the traders are quite disappointed due to the continuous fall in the coin. Also, the coin is not demonstrating any sign of improvement. There are anticipations that the coin would start recovering from the coming week.
The coin is reflecting a heavy price drop. On 8th August, the coin slipped from $11.3 to $10.95 by 3.64%. On 9th August, the coin slipped from $10.95 to $10.75 by 1.85%. On 10th August, the coin continued the downtrend. The coin switched places from $10.75 to $10.61 by 1.31%. On 11th August, the coin climbed from $10.61 to $11.08 by 4.48%. On 12th August, the coin slipped from $11.08 to $10.65. The regression was of 3.86%. The downtrend continued on 13th August too. The price dropped from $10.65 to $10.53, Today, the coin again opened with a downfall of $3.02% as the price changed from $10.53 to $10.21.
The traders are recommended to stay put with NEO. The coin is likely to rise after the market pressure is lightened.


